Annex 5: Mapping uses, interests, and values
On this page
Uses, interests and values of relevance in Waikato
Figure 8 shows the areas of customary rights and applications. As there is considerable overlap of areas, particularly within the Territorial Sea, readers are advised to consult individual information sources such as Te Kete Kōrero a Te Takutai Moana Information Hub* and the Ministry for Primary Industries NABIS web map.
National Aquatic Biodiversity System(external link)
Rohe Moana areas are labelled in italics starting with TK and generally extend seaward from the coast, however some extend onshore.
* Te Kete Kōrero a Te Takutai Moana Information Hub(external link)
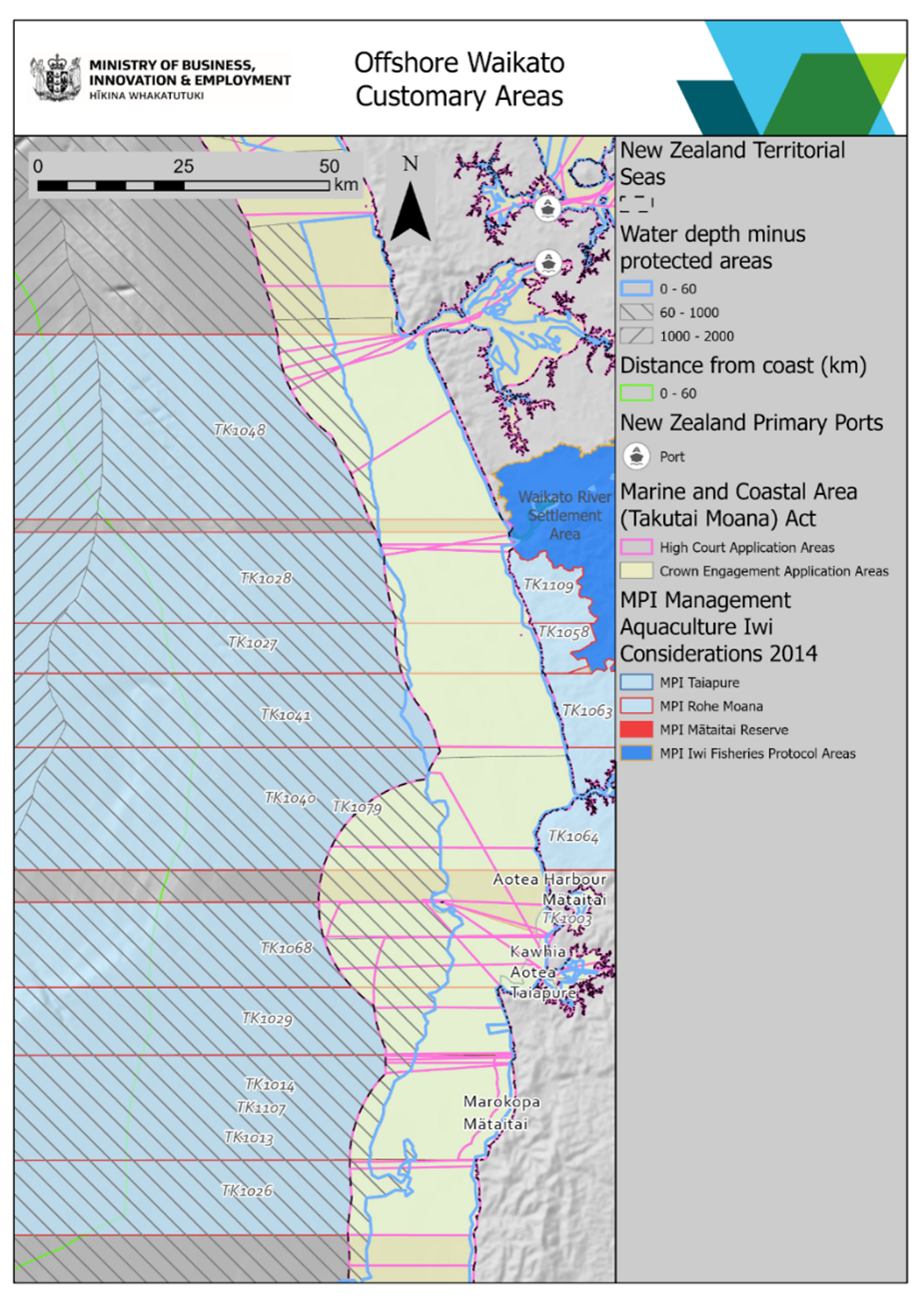
Figure 8
Image transcript
Figure 9 shows the fishing intensity annually averaged commercial catch (kg/ha) from all fishing methods (except freshwater fishing) reported to the Ministry for Primary Industries (MPI) from 2007 – 2019.
For more information see:
MPI All Fishing Intensity 2007-2019(external link) — Ministry for Primary Industries
It can be seen that the highest levels of activity are along the continental shelf edge and slope, in water depths greater than 100 m. It should be noted that there are 2 submarine cable and pipeline protection zones on the map: a large zone to the north of the area and a small near shore zone just south of the Albatross Point headland.
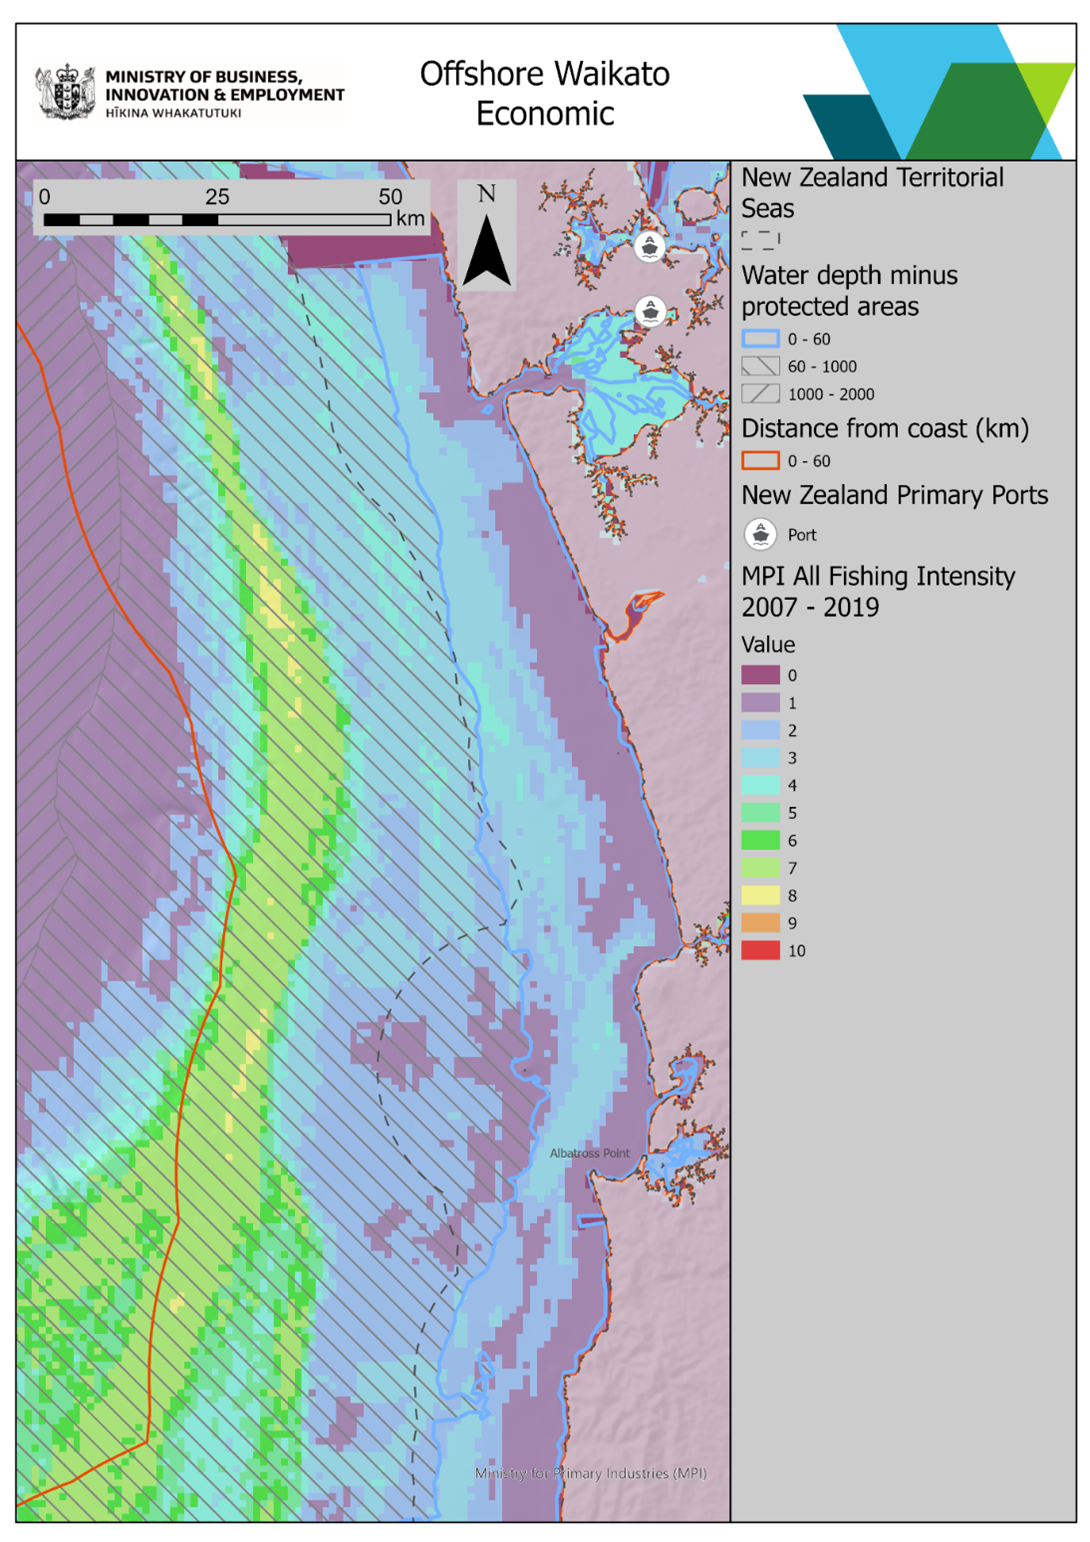
Figure 9
Figure 10 shows the extent of the Marine Mammal Sanctuary, which in this area is congruent with the Territorial Sea boundary (12 nautical mile). Within the extent of the map, Marine Reserves are limited to the inner Waitematā Harbour.
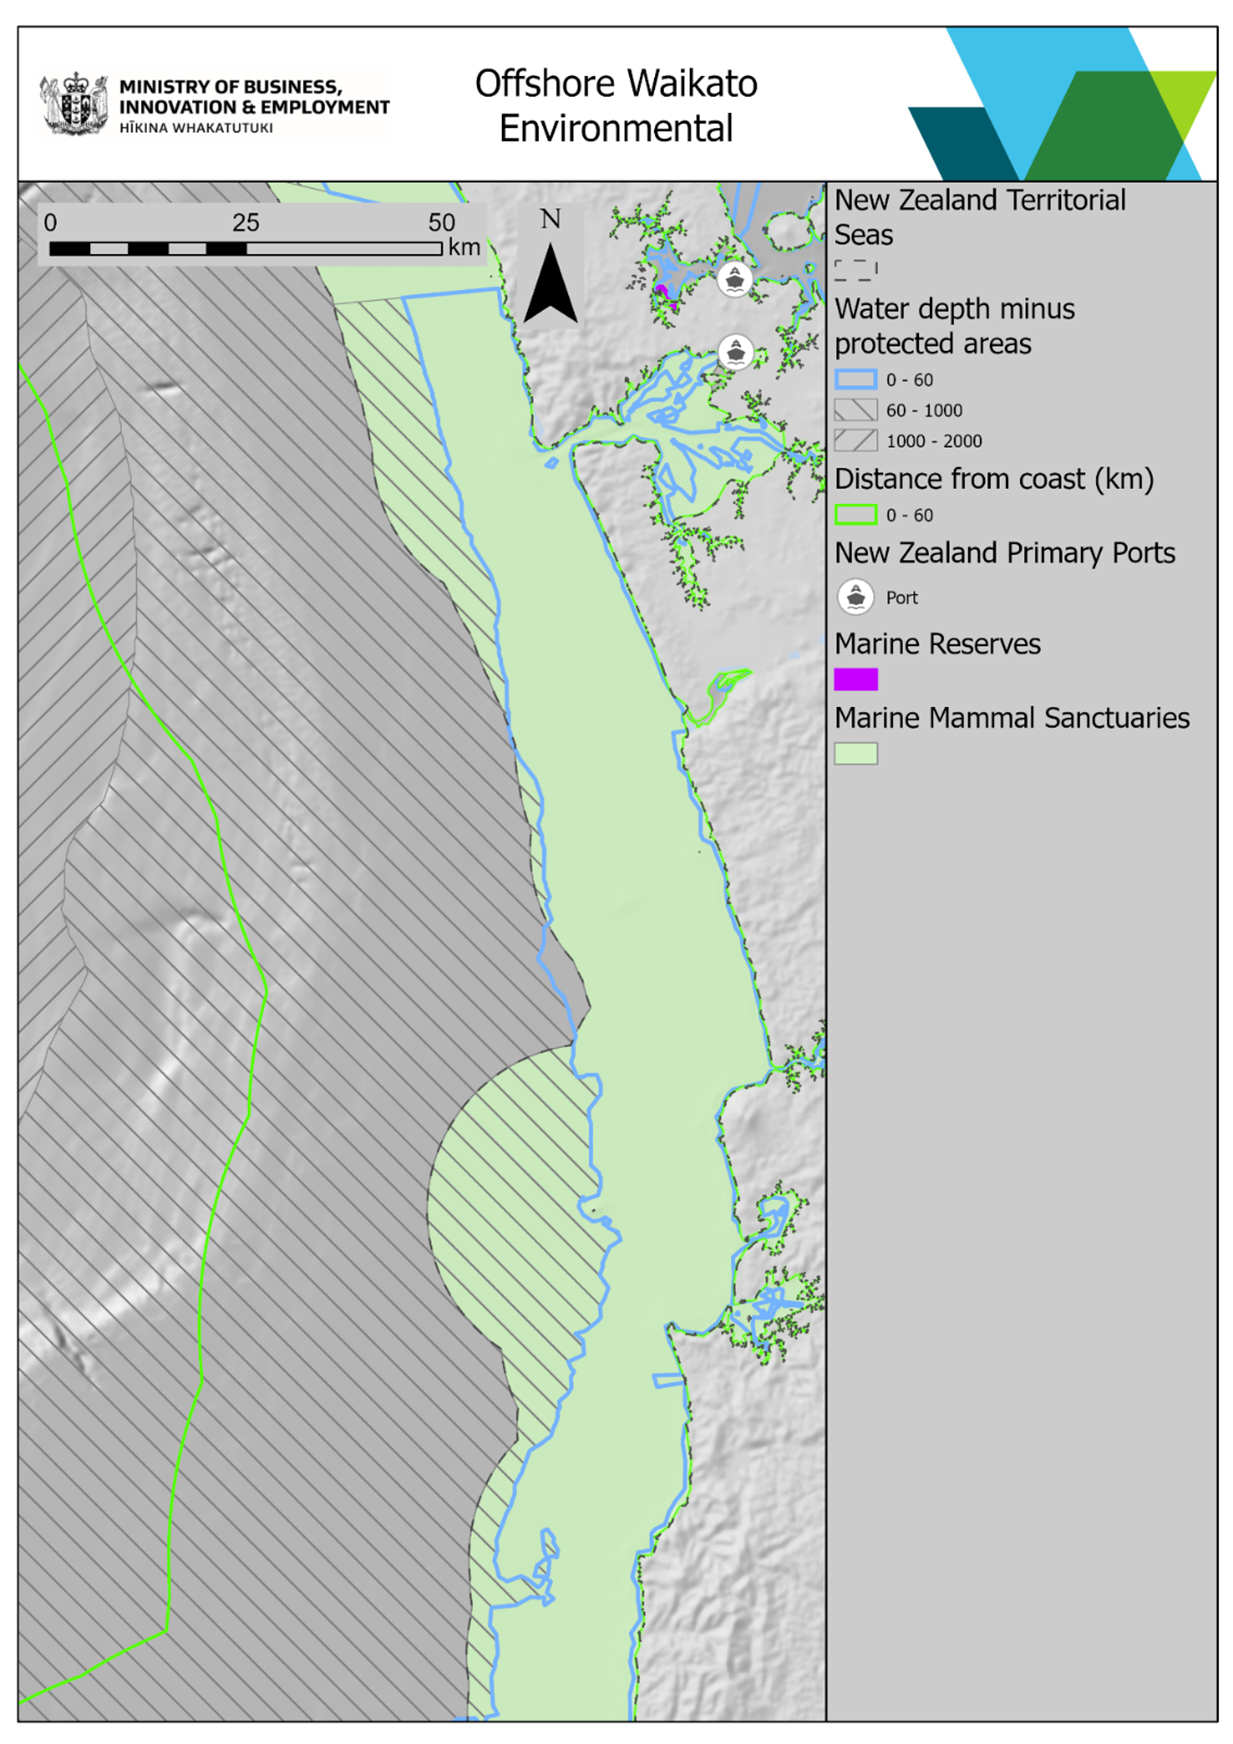
Figure 10
Image transcript
Figure 11 shows the reported position of vessels (of types noted in legend) operating an Automated Identification System (AIS) transponder for the year 2019. Higher density of vessel tracks indicates frequently used shipping “lanes”.
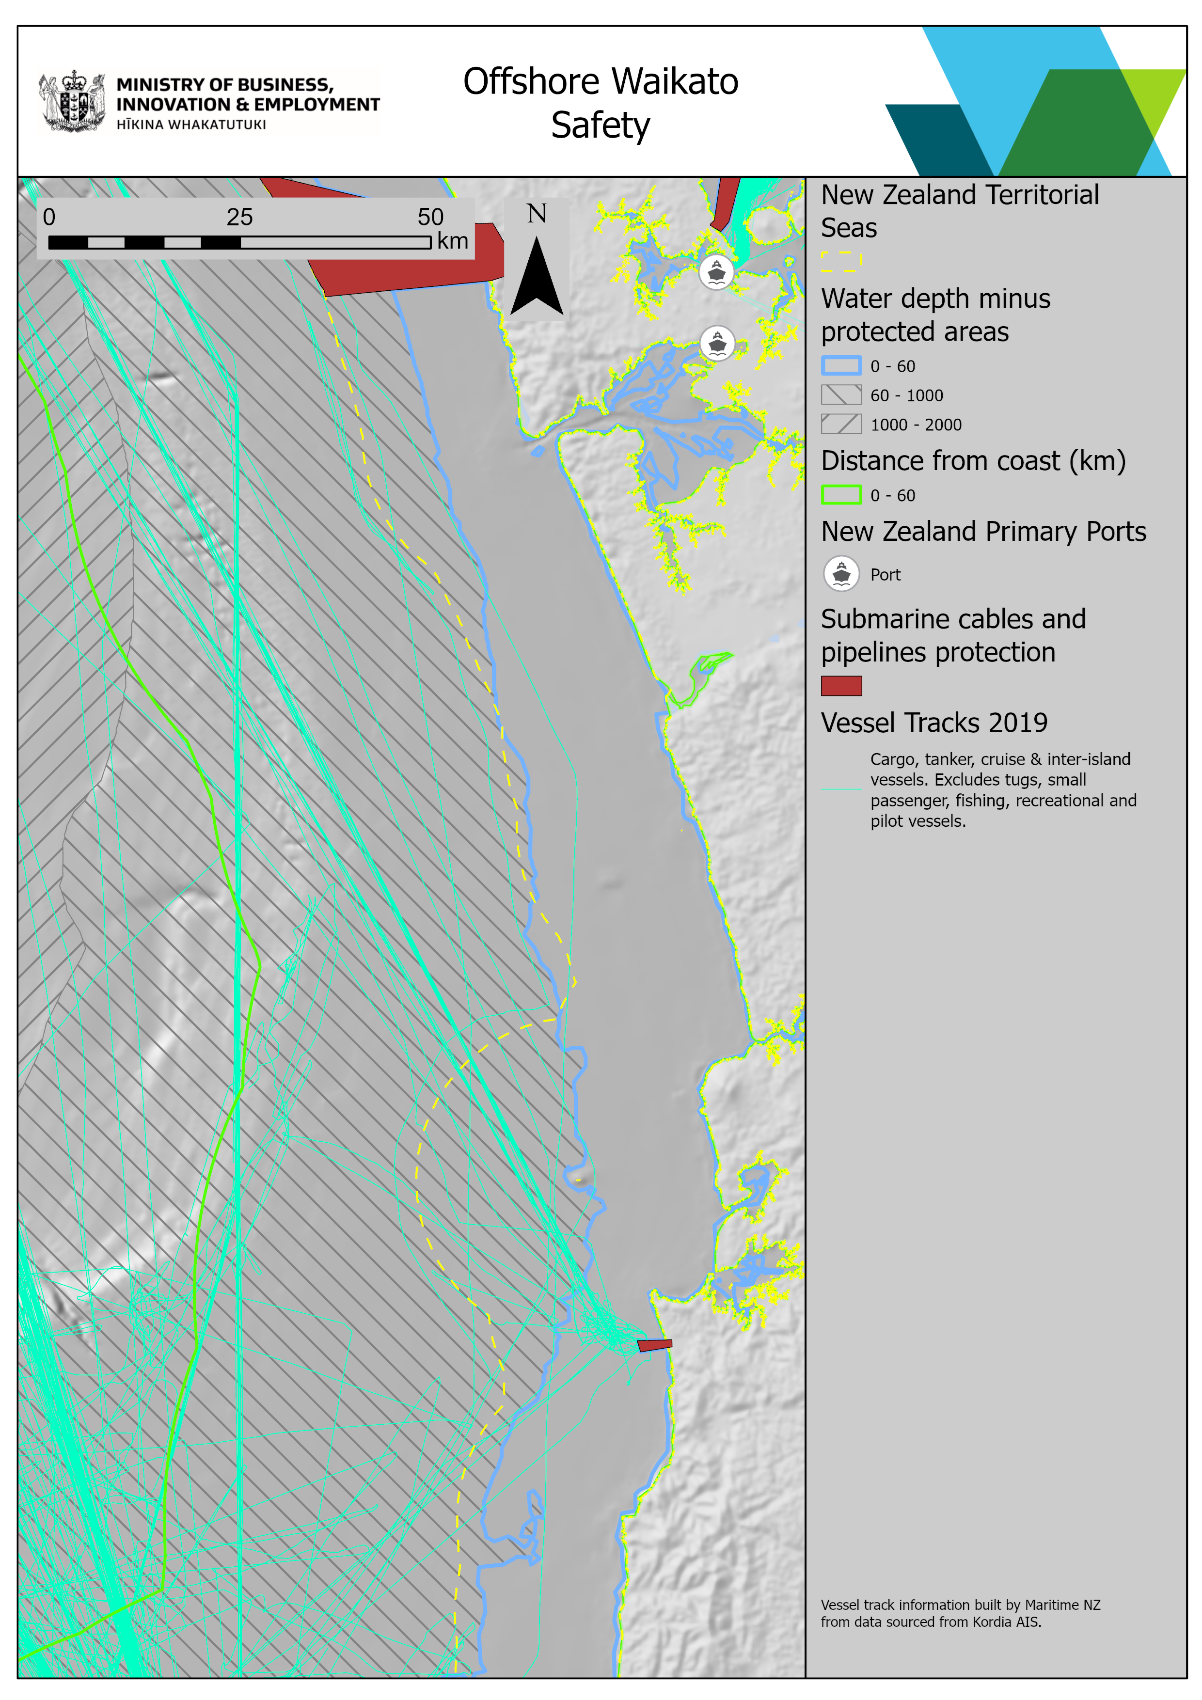
Figure 11
Image transcript
Figure 12 shows the distribution of recreational fishing activity, based on the aerial survey conducted by the Ministry for Primary Industries. Activity is effectively fully contained within the Territorial Sea (12 nautical mile) limits.
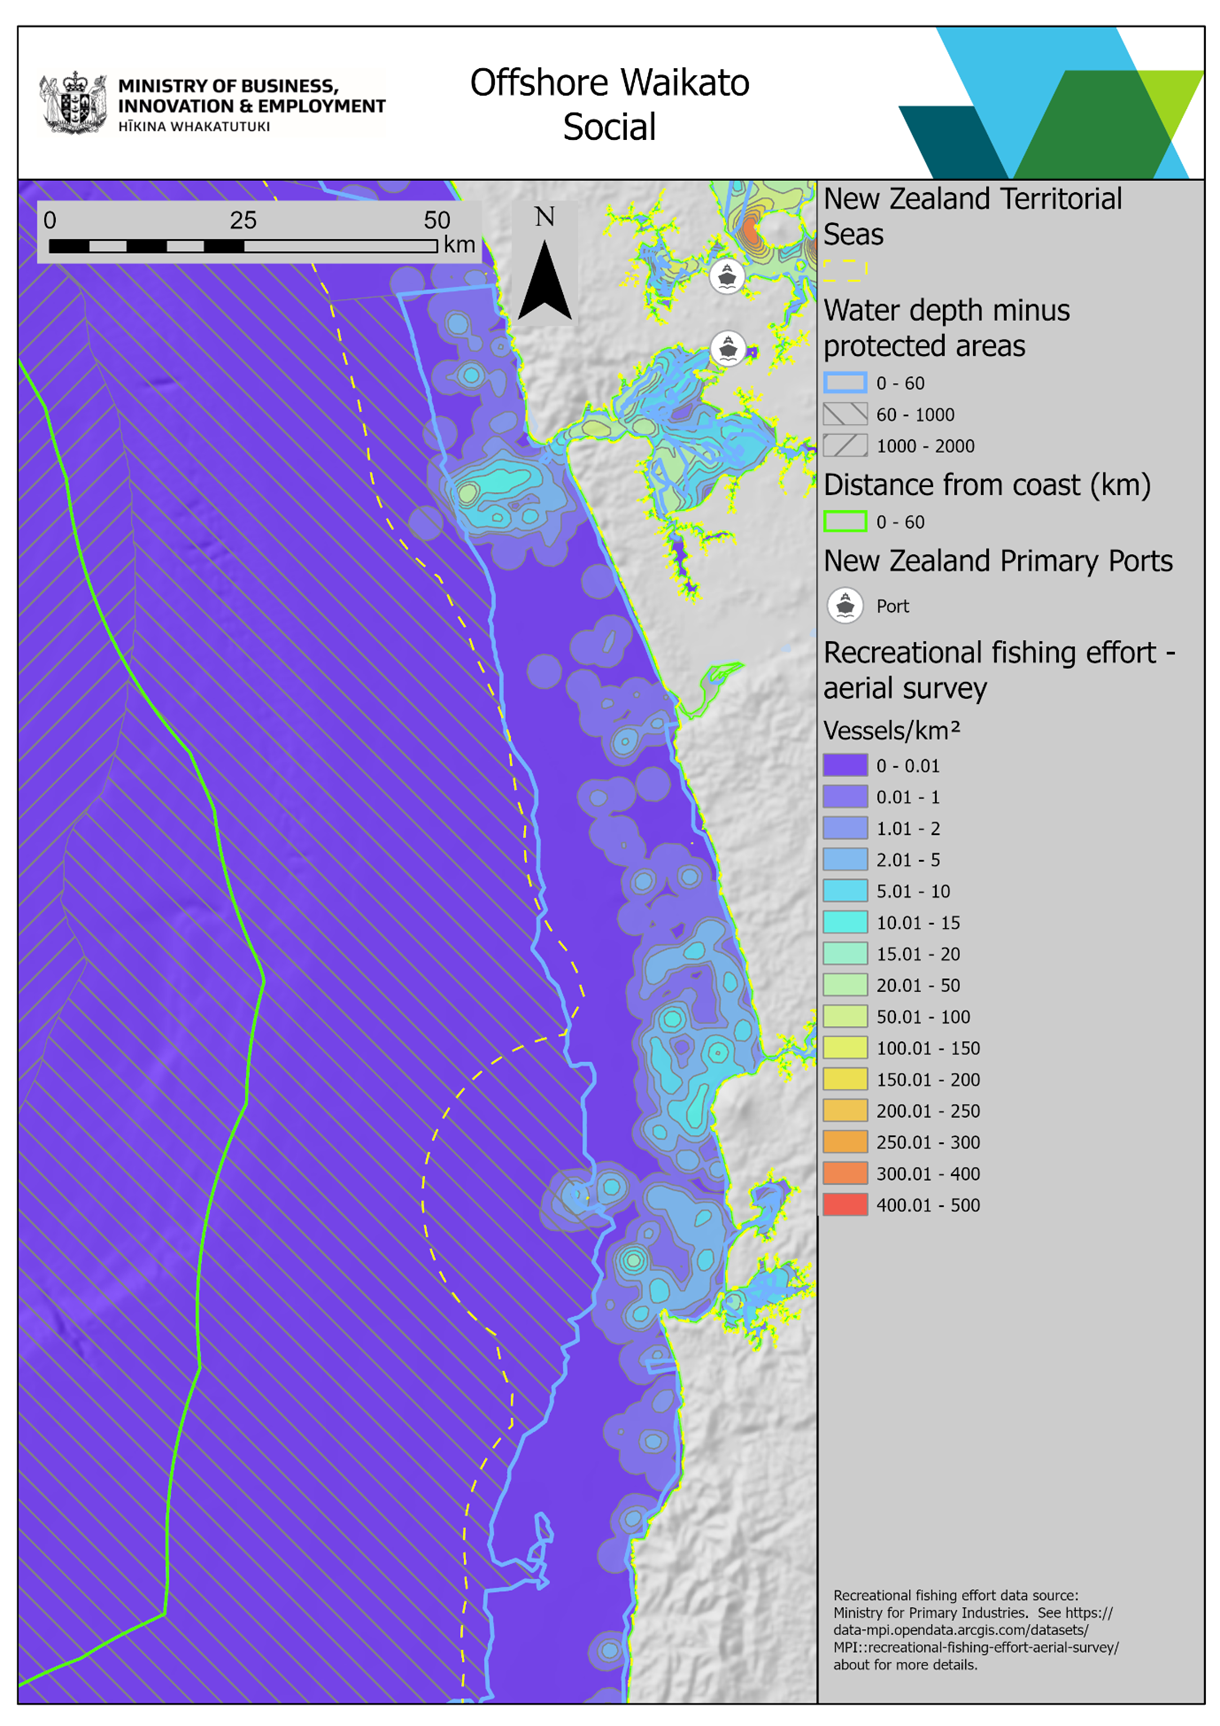
Figure 12
Image transcript
Uses, interests and values of relevance in Taranaki
Figure 13 shows the areas of customary rights and applications. As there is considerable overlap of areas, particularly within the Territorial Sea, readers are advised to consult individual information sources such as Te Kete Kōrero a Te Takutai Moana Information Hub and the Ministry for Primary Industries NABIS web map. Rohe Moana areas from Kaimoana Customary Fishing Notices are labelled in italics starting with TK and generally extend seaward from the coast, however some extend onshore. Rohe Moana areas from Notification of Tāngata Kaitiaki/Tiaki for Area/Rohe Moana of Te Tai Hauāuru labelled in bold red font.
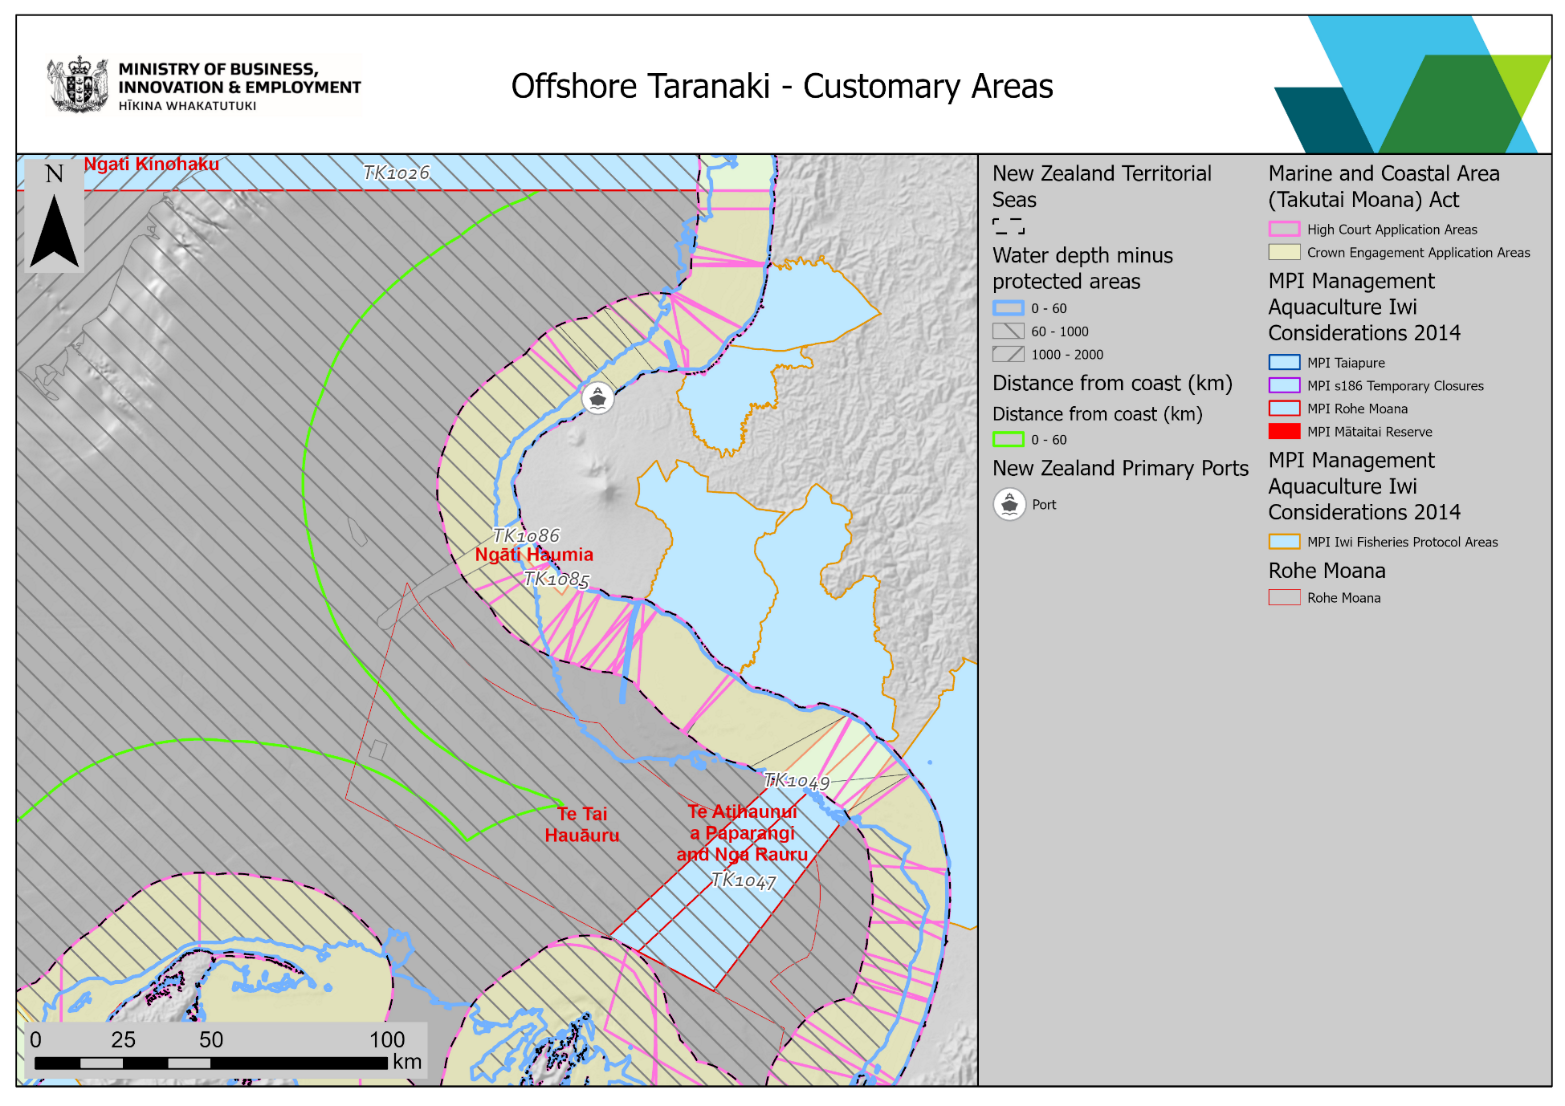
Figure 13
Image transcript
Image transcript
Figure 14 shows the fishing intensity annually averaged commercial catch (kg/ha) from all fishing methods (except freshwater fishing) reported to the Ministry for Primary Industries (MPI) from 2007 – 2019.
For more information see:
MPI All Fishing Intensity 2007-2019(external link) — Ministry for the Primary Industries
It can be seen that the highest levels of activity are on the continental shelf of the South Taranaki Bight, generally in water depths greater than 90 m.
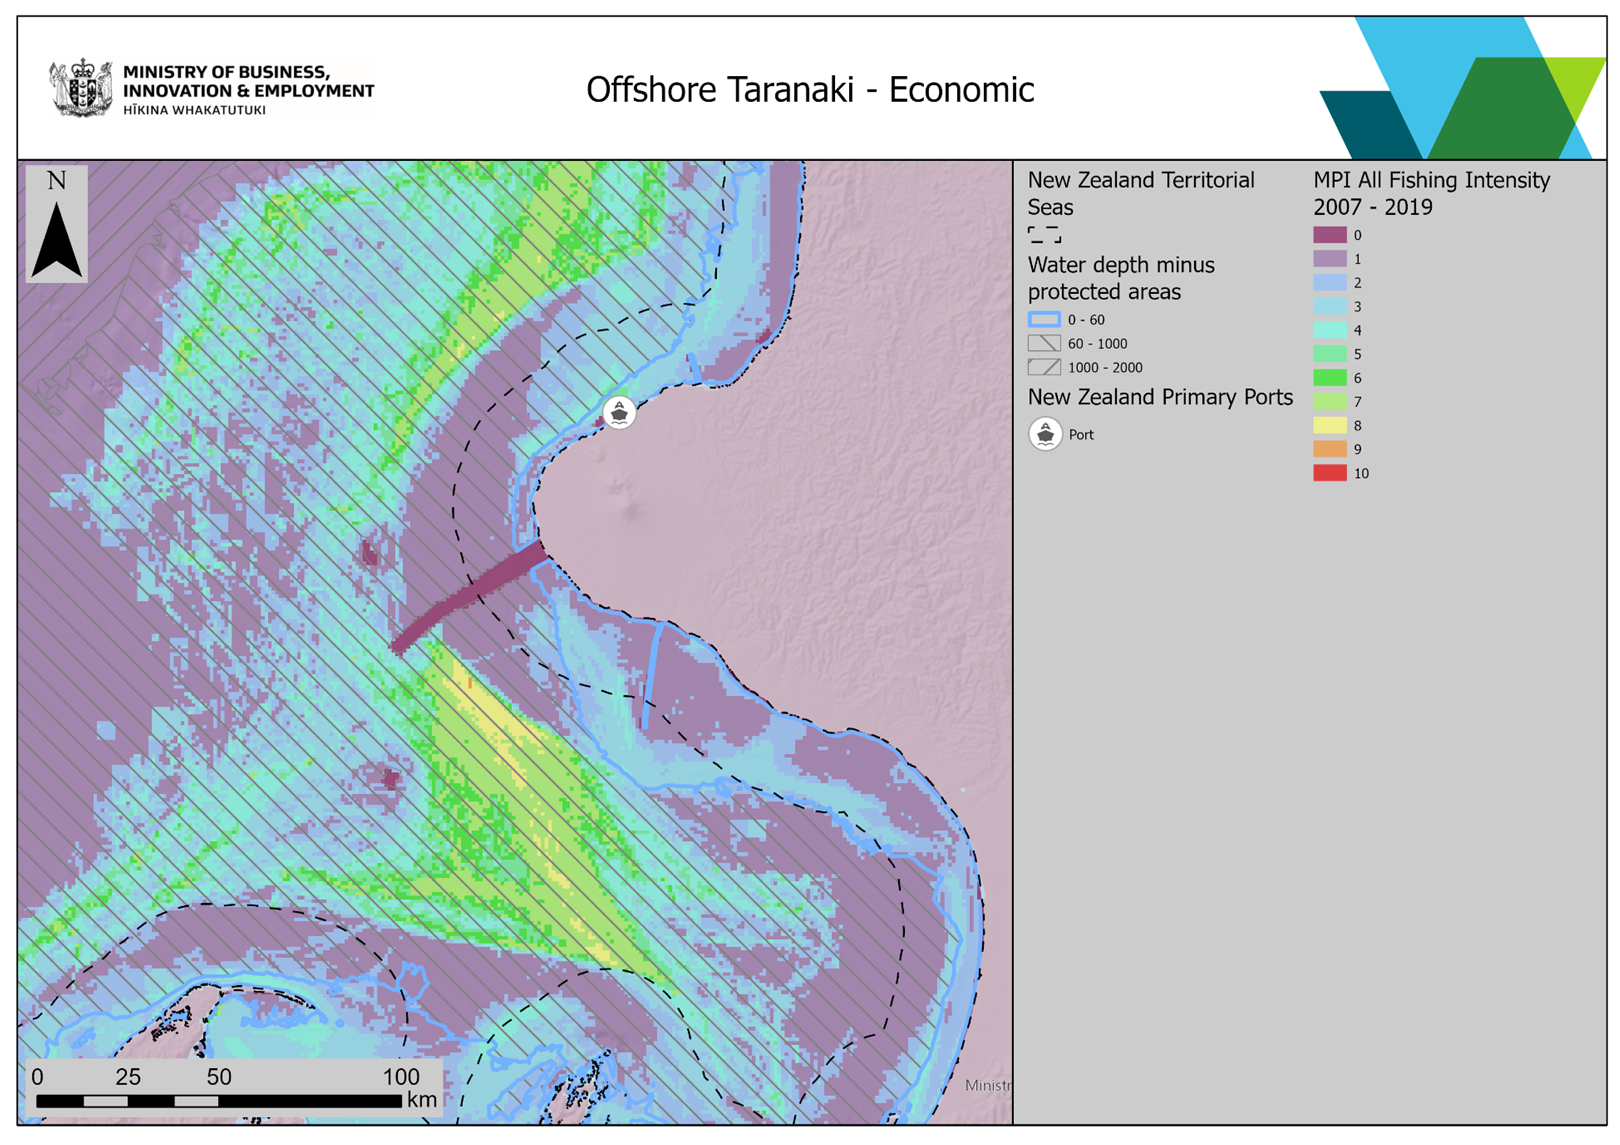
Figure 14
Image transcript
Figure 15 shows the extent of the Marine Mammal Sanctuary, which in this area is congruent with the Territorial Sea (12 nautical mile). Within the extent of the map, Marine Reserves are limited to the northern Taranaki coast and top of the South Island.
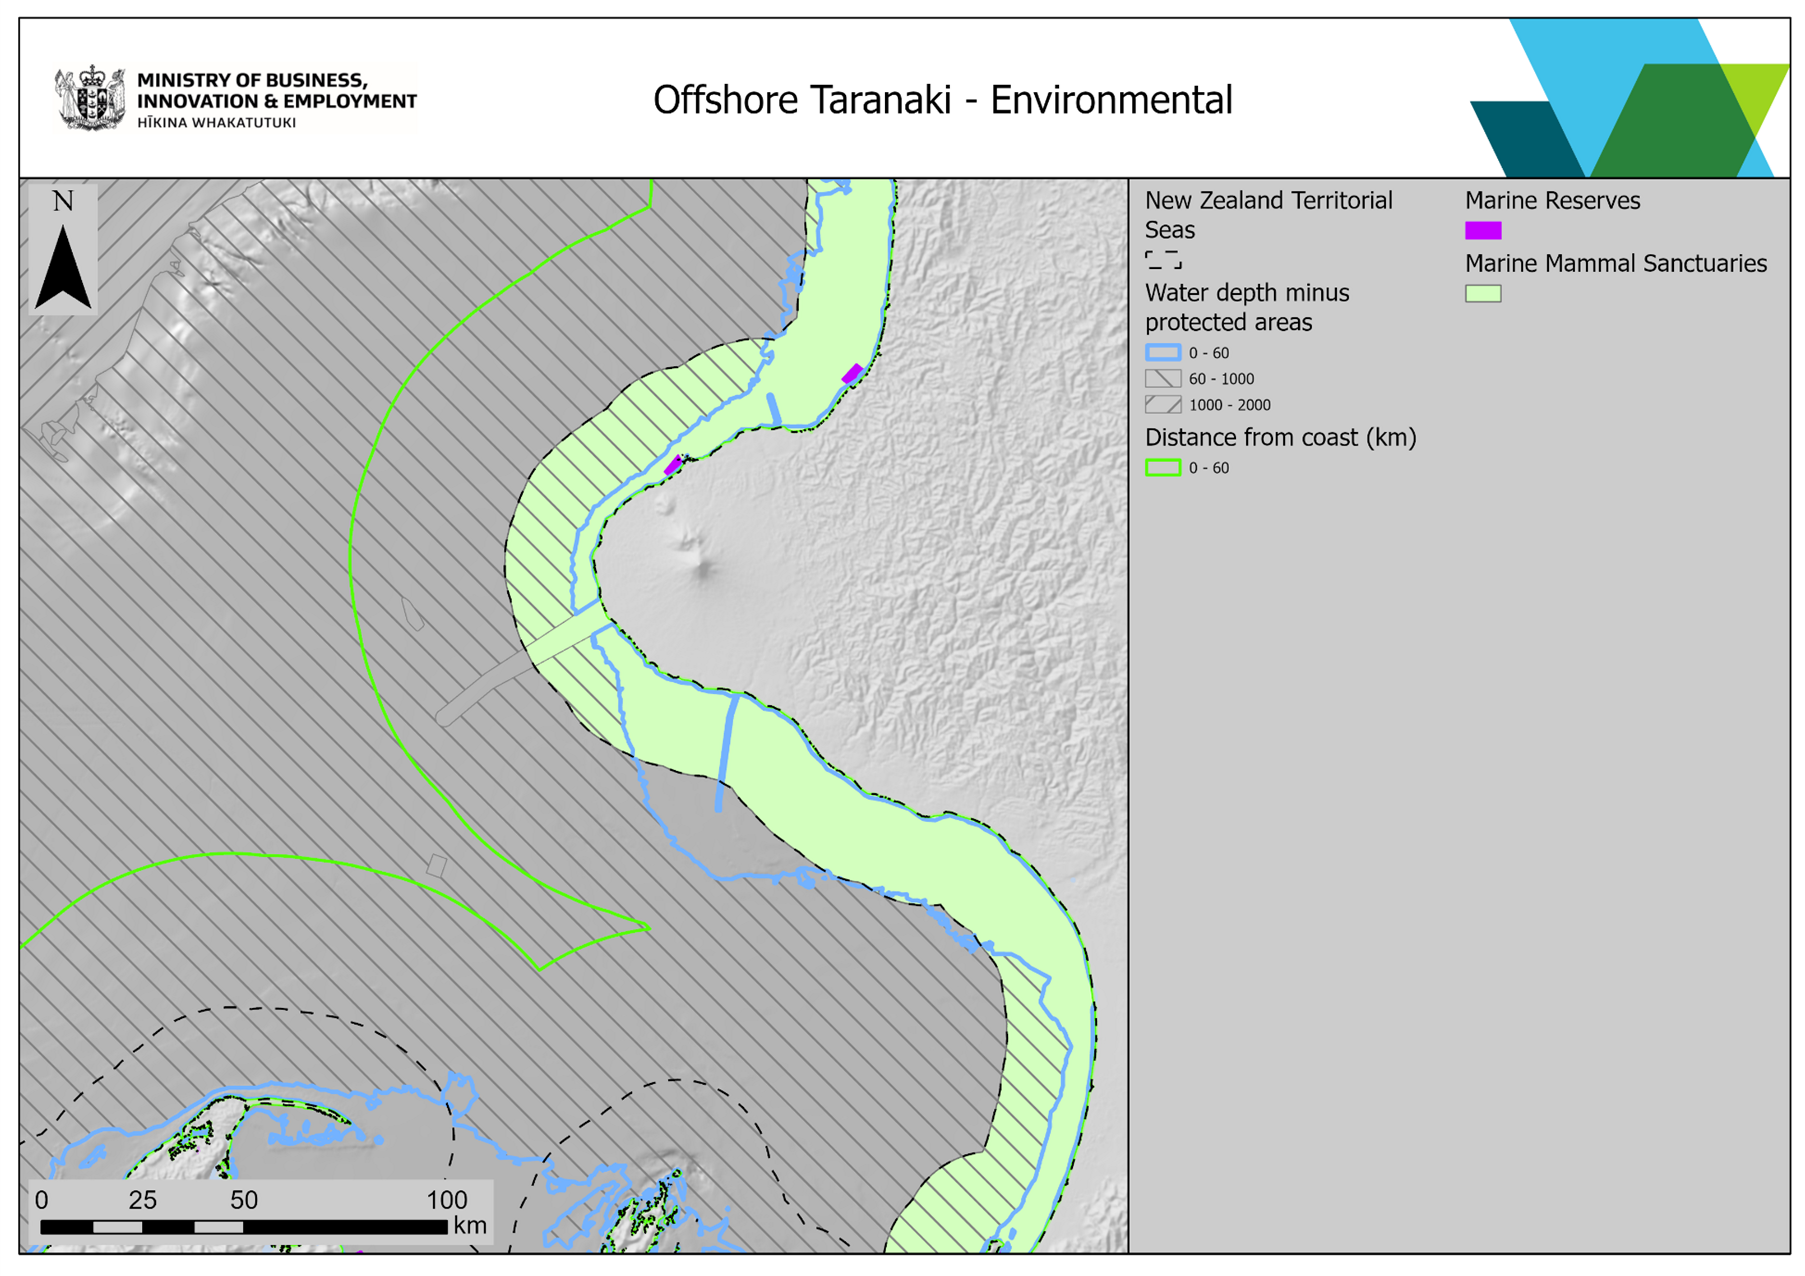
Figure 15
Image transcript
Figure 16 shows the reported position of vessels (of types noted in legend) operating an Automated Identification System (AIS) transponder for the year 2019. Higher density of vessel tracks indicates frequently used shipping “lanes”. Note the correlation between vessel density and fishing activity shown in Figure 10.
For more details on AIS see:
AIS transponders(external link) — International Maritime Organization

Figure 16
Image transcript
Figure 17 shows the distribution of recreational fishing activity, based on the aerial survey conducted by the Ministry for Primary Industries. Activity is effectively fully contained within the Territorial Sea (12 nautical mile) limits.
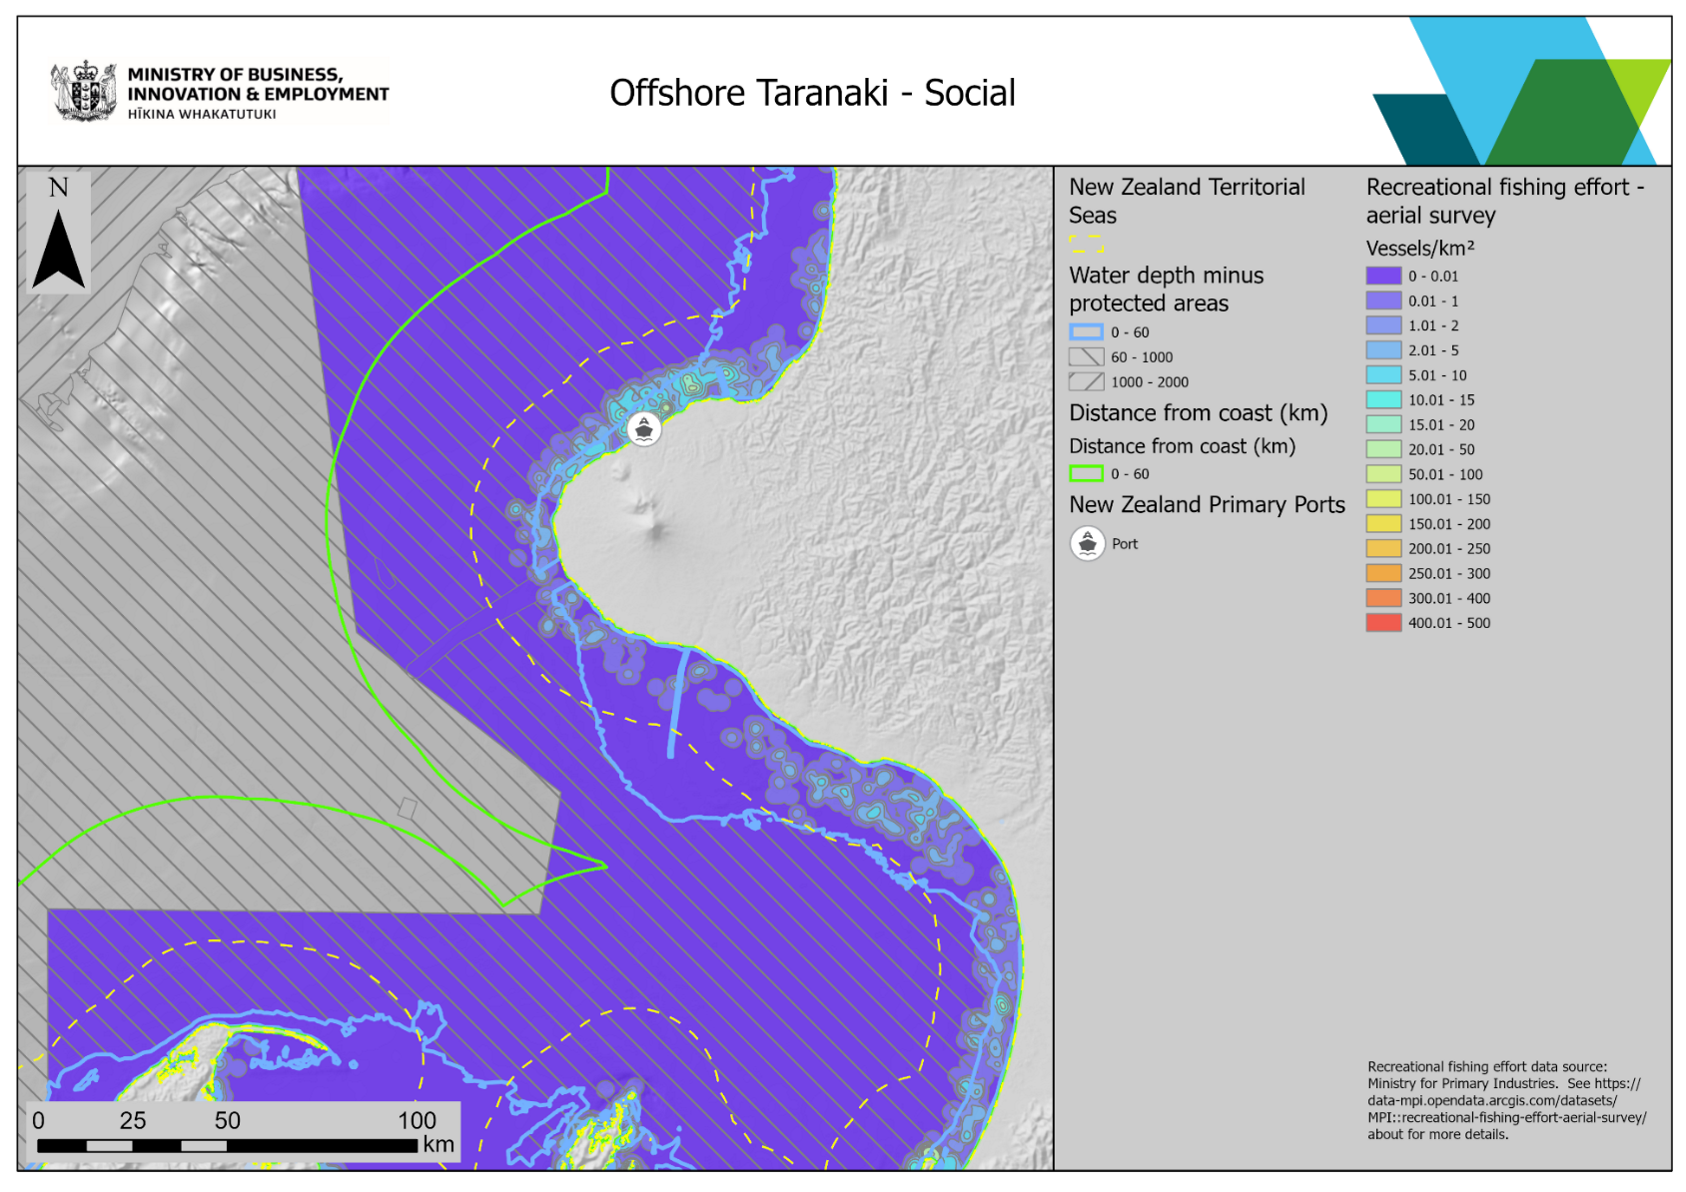
Figure 17
Image transcript
Uses, interests and values of relevance in Southland
Figure 18 shows the areas of customary rights and applications. As there is considerable overlap of areas, particularly within the Territorial Sea, readers are advised to consult individual information sources such as Te Kete Kōrero a Te Takutai Moana Information Hub and the Ministry for Primary Industries NABIS web map.
Te Kete Kōrero a Te Takutai Moana Information Hub(external link)
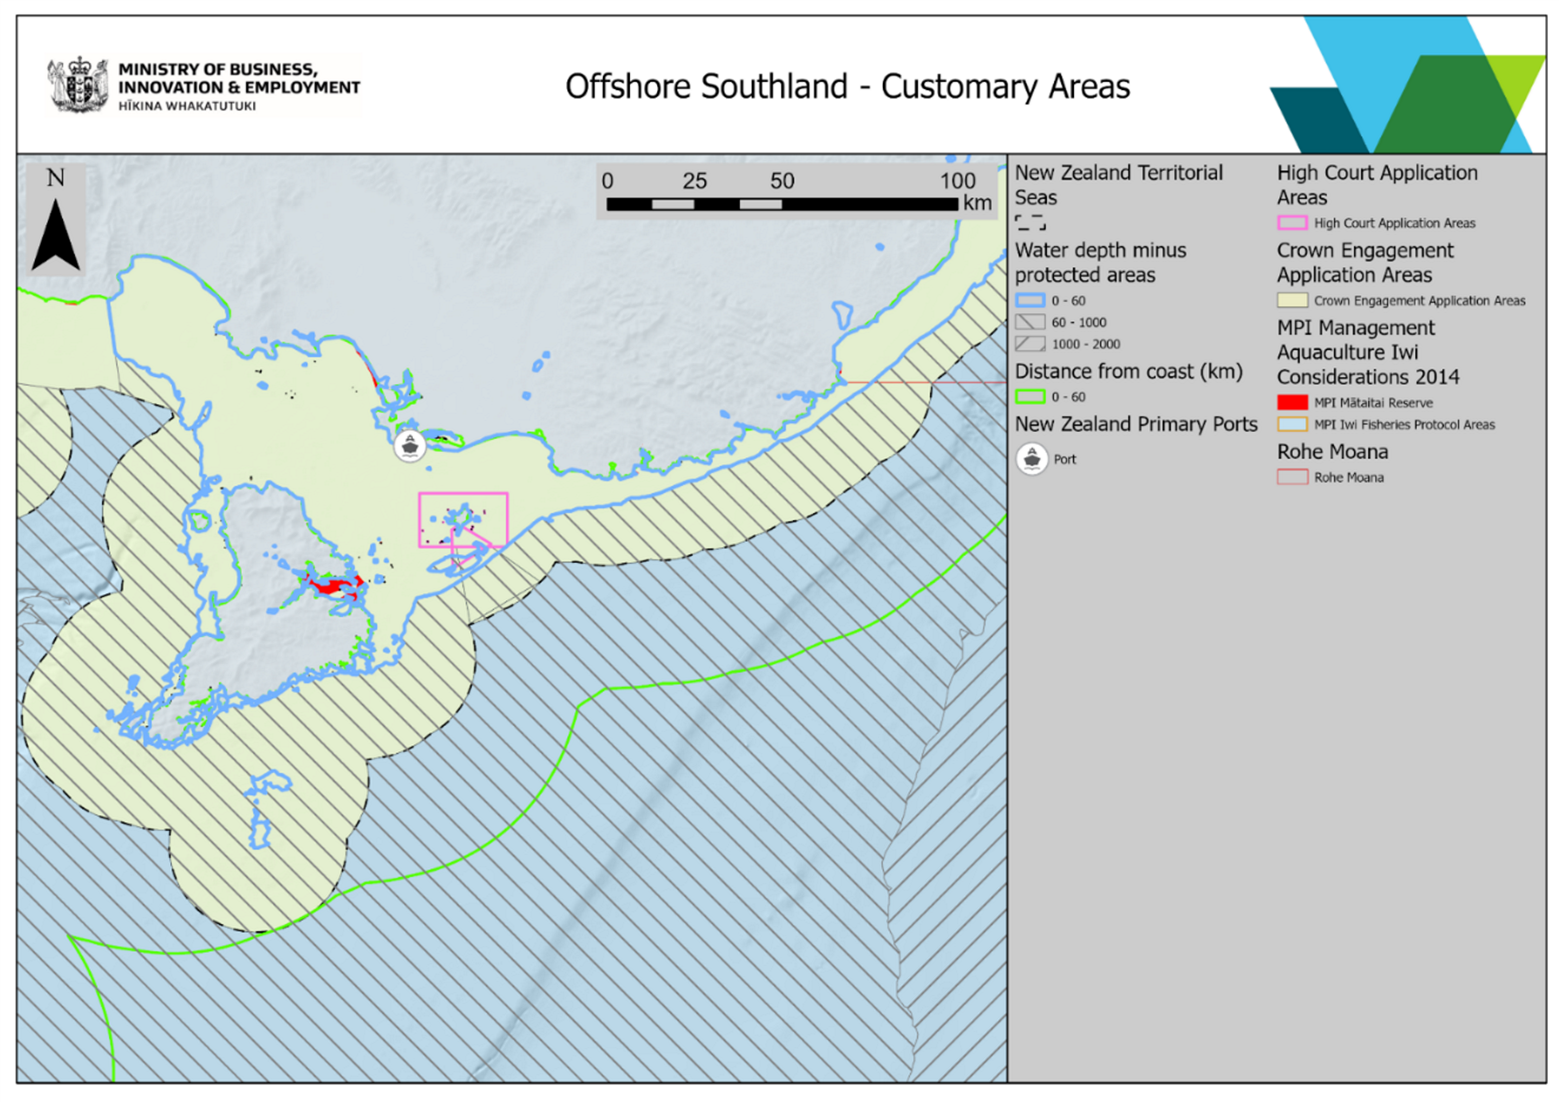
Figure 18
Image transcript
Figure 19 shows the fishing intensity annually averaged commercial catch (kg/ha) from all fishing methods (except freshwater fishing) reported to the Ministry for Primary Industries (MPI) from 2007 – 2019.
For more information see:
MPI All Fishing Intensity 2007-2019(external link) — Ministry for Primary Industries
It can be seen that the highest levels of activity are within Foveaux Strait, just outside the territorial sea boundary and along the outer continental shelf and slope. Marine farms are predominantly contained within Big Glory Bay on Rakiura / Stewart Island, and Bluff Harbour.
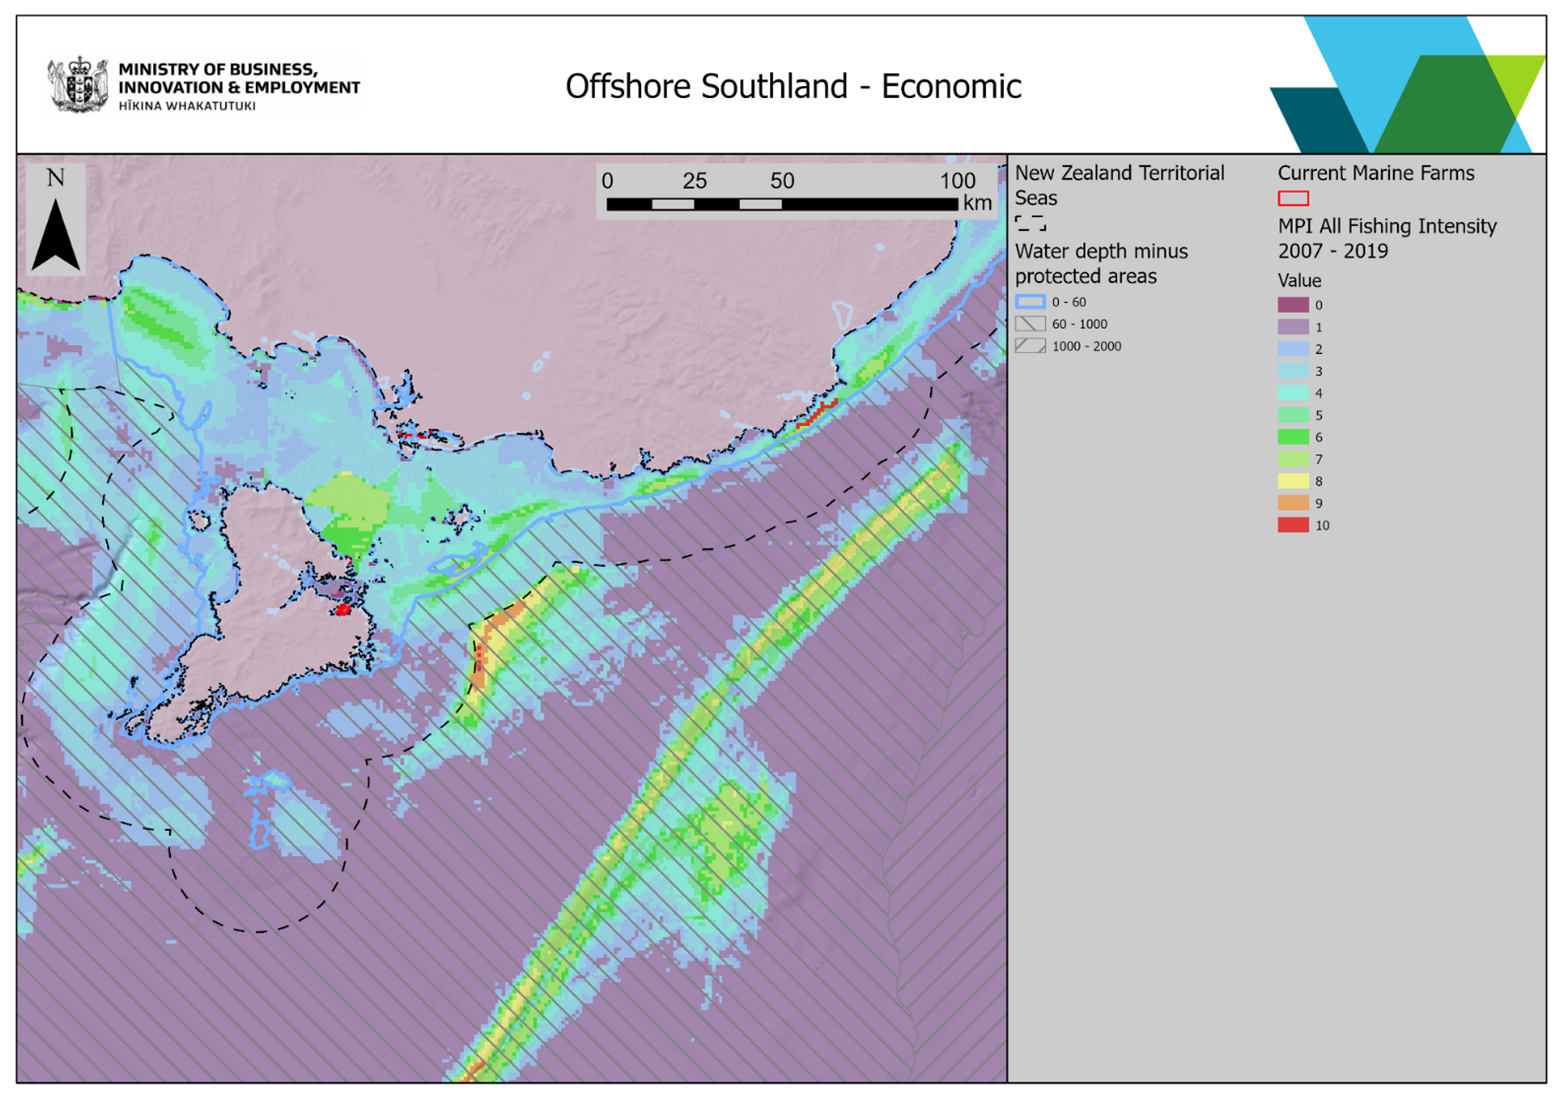
Figure 19
Image transcript
Figure 20 shows the extent of Marine Mammal Sanctuaries. Within the extent of the map, Marine Reserves are limited to Te Whaka a Te Were / Peterson Inlet.
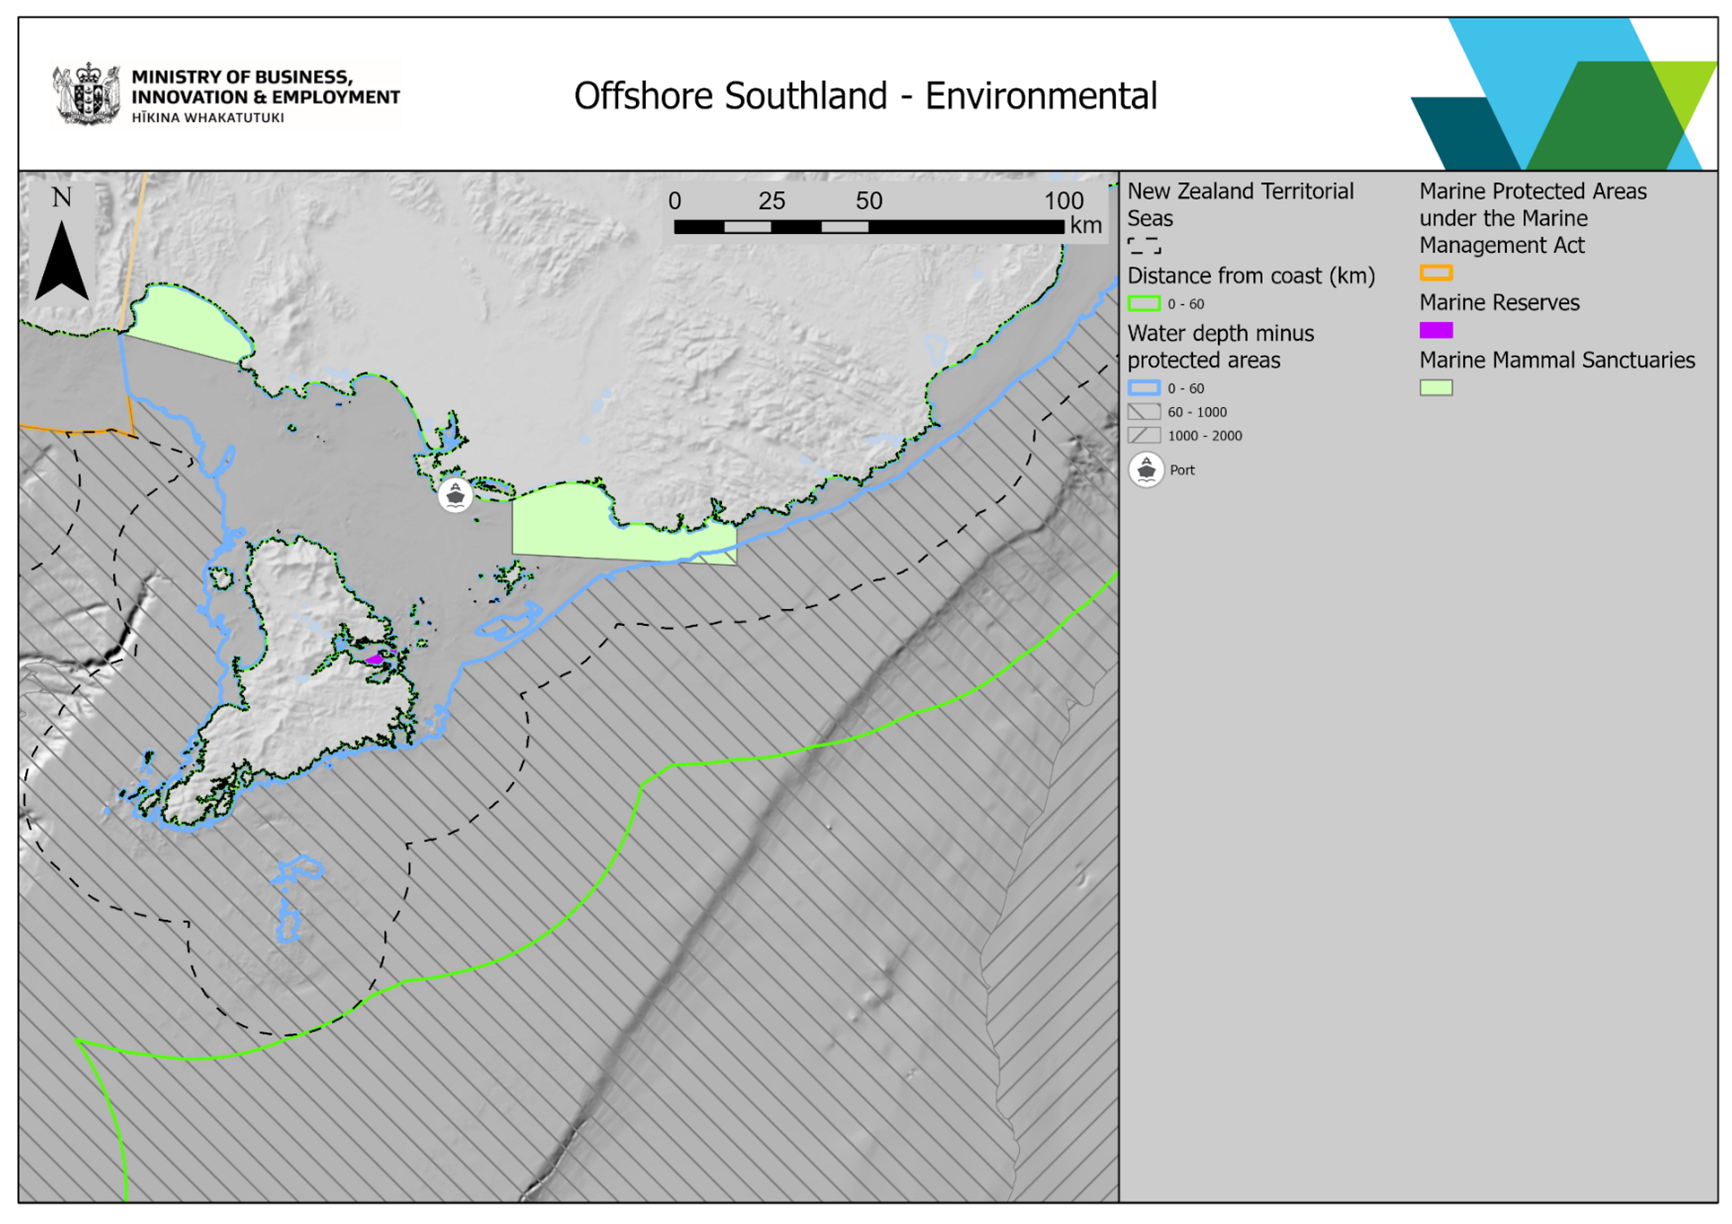
Figure 20
Image transcript
Figure 21 shows the reported position of vessels (of types noted in legend) operating an Automated Identification System (AIS) transponder for the year 2019. Higher density of vessel tracks indicates frequently used shipping “lanes”.
For more details on AIS see:
AIS transponders(external link) — International Maritime Organization
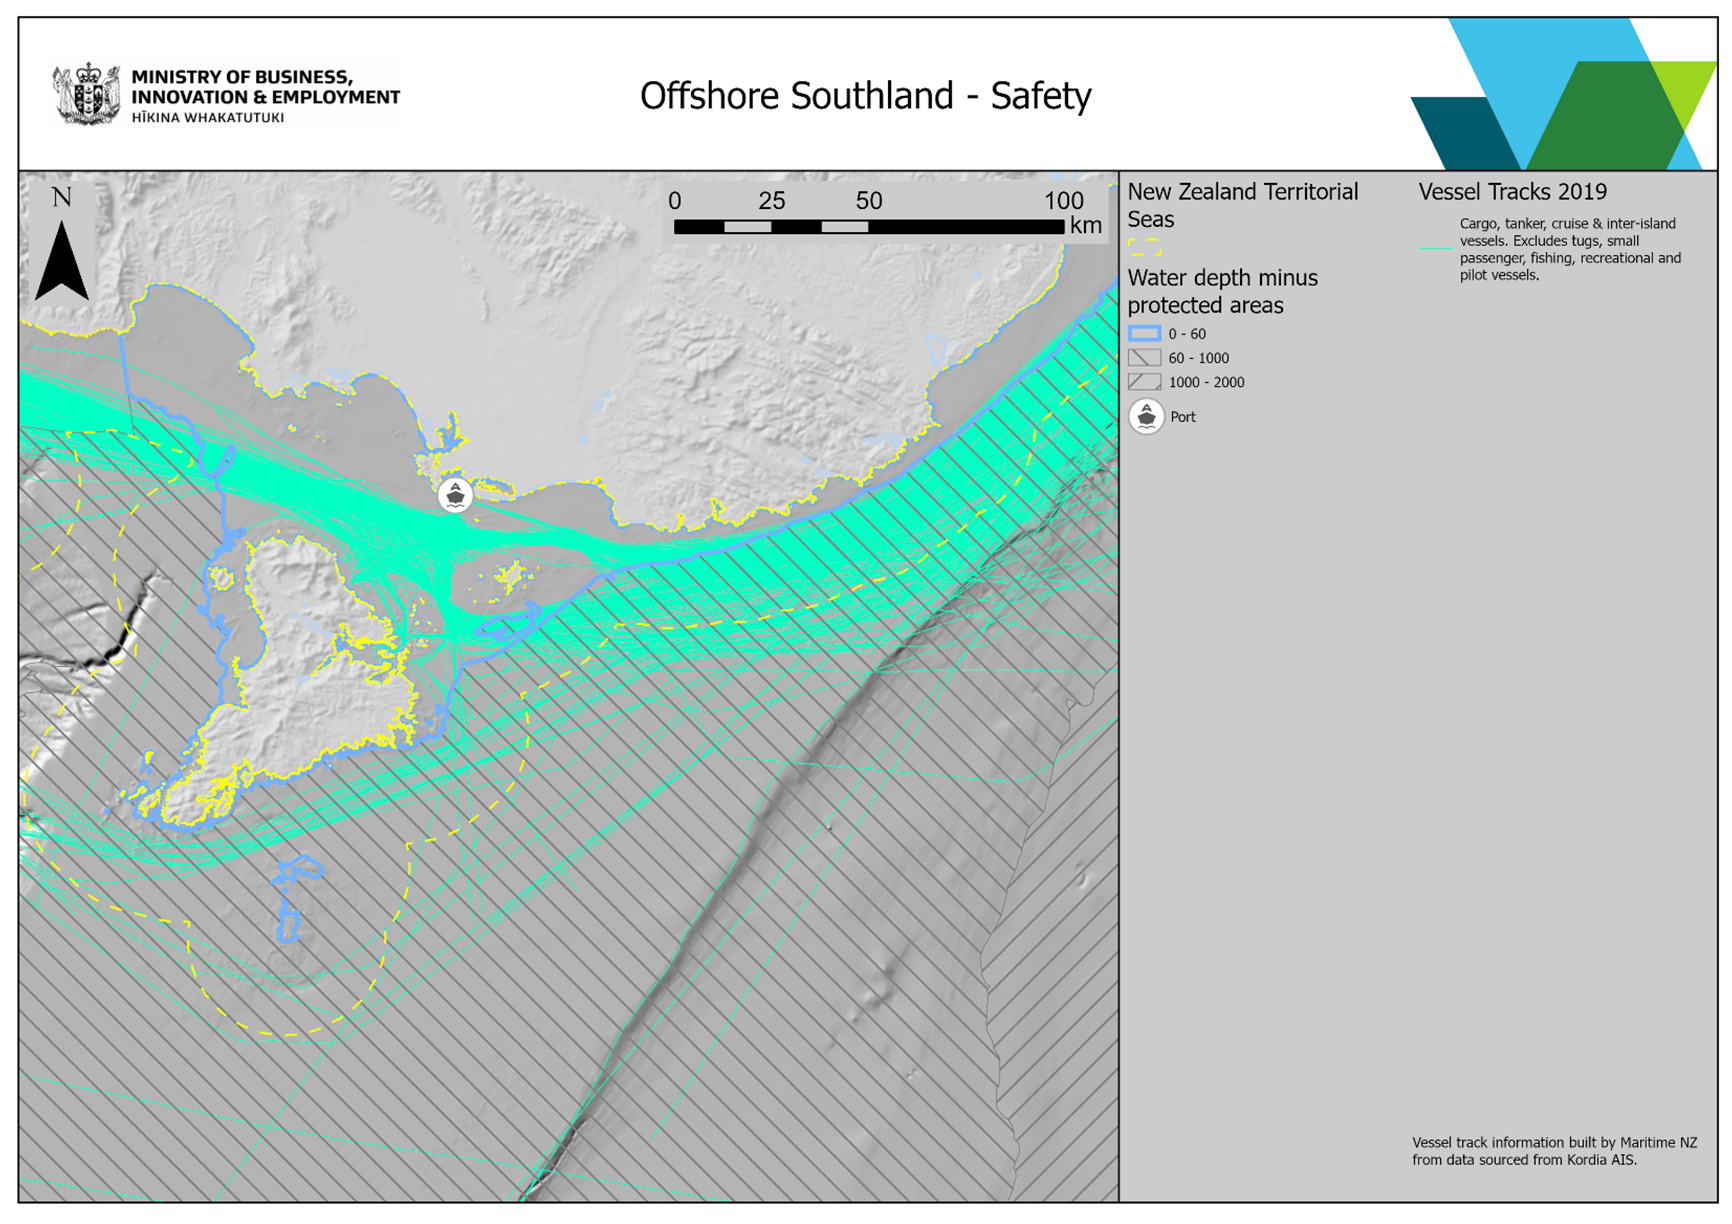
Figure 21
Image transcript
The recreational fishing activity survey conducted by the Ministry for Primary Industries does not extend to the Southland region. Figure 22 is included for completeness only.
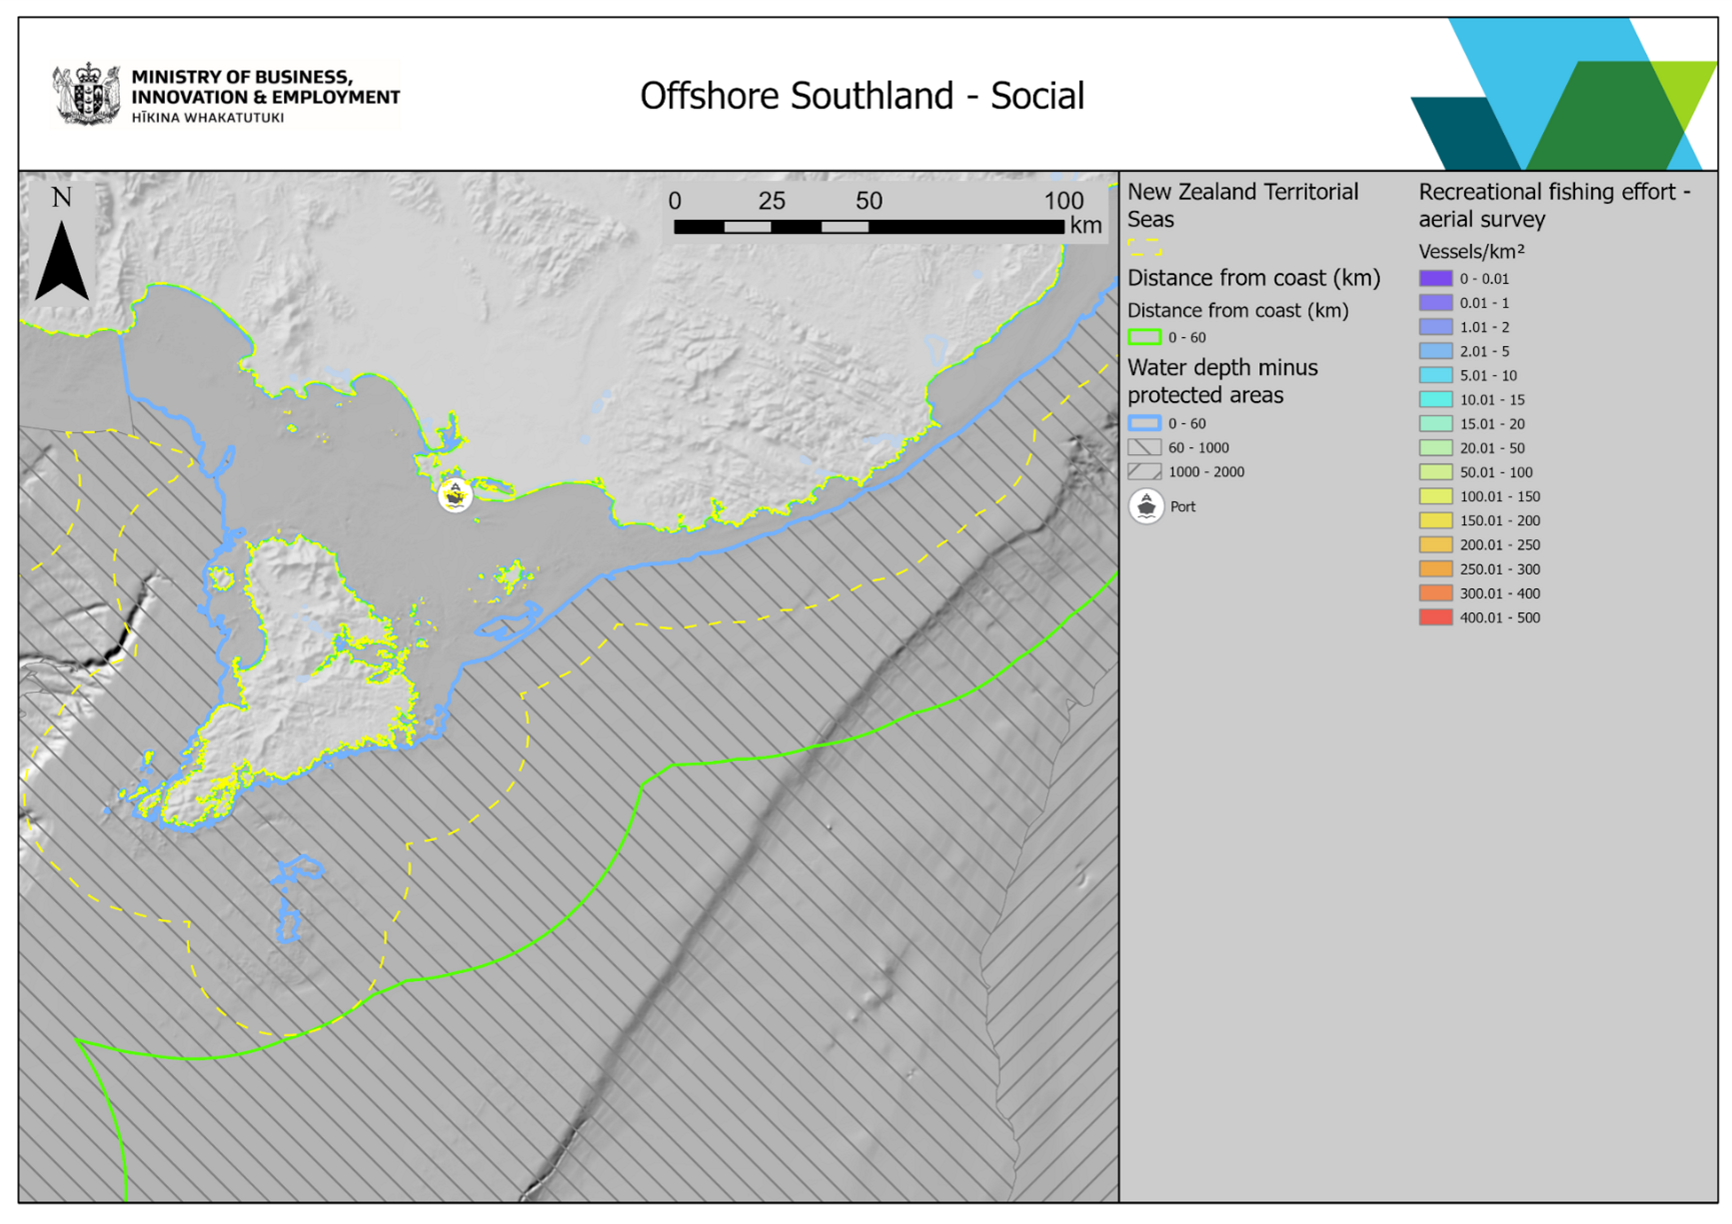
Figure 22
Image transcript