Te uru me te whakamahi i te tūāhanga rangahau | Access and use of research infrastructure
An important aspect of the Kitmap project was not only to understand what infrastructure we have, but also how it is accessed and used. This includes who uses the infrastructure, how they get access to it, and how it is maintained. Information about access to infrastructures is also a key input for the future Kitmap online tool.
On this page
The Kitmap survey asked a range of questions about access policies for external users of the infrastructure, including whether access was granted by academic merit, commercial agreements, or was open/unrestricted, and in each of these cases, whether there are costs involved for the user. Institutions were also asked whether external users could utilise the infrastructures/resources in-person (ie on-site use with supervision/training), however, those data were ultimately not included in this report due to ambiguity of the responses.
The survey results indicated that each institution has a different approach to access and use of their infrastructure, and that access policies for research infrastructures vary significantly both within and across institutions.
More than half of research infrastructures are accessible to external users
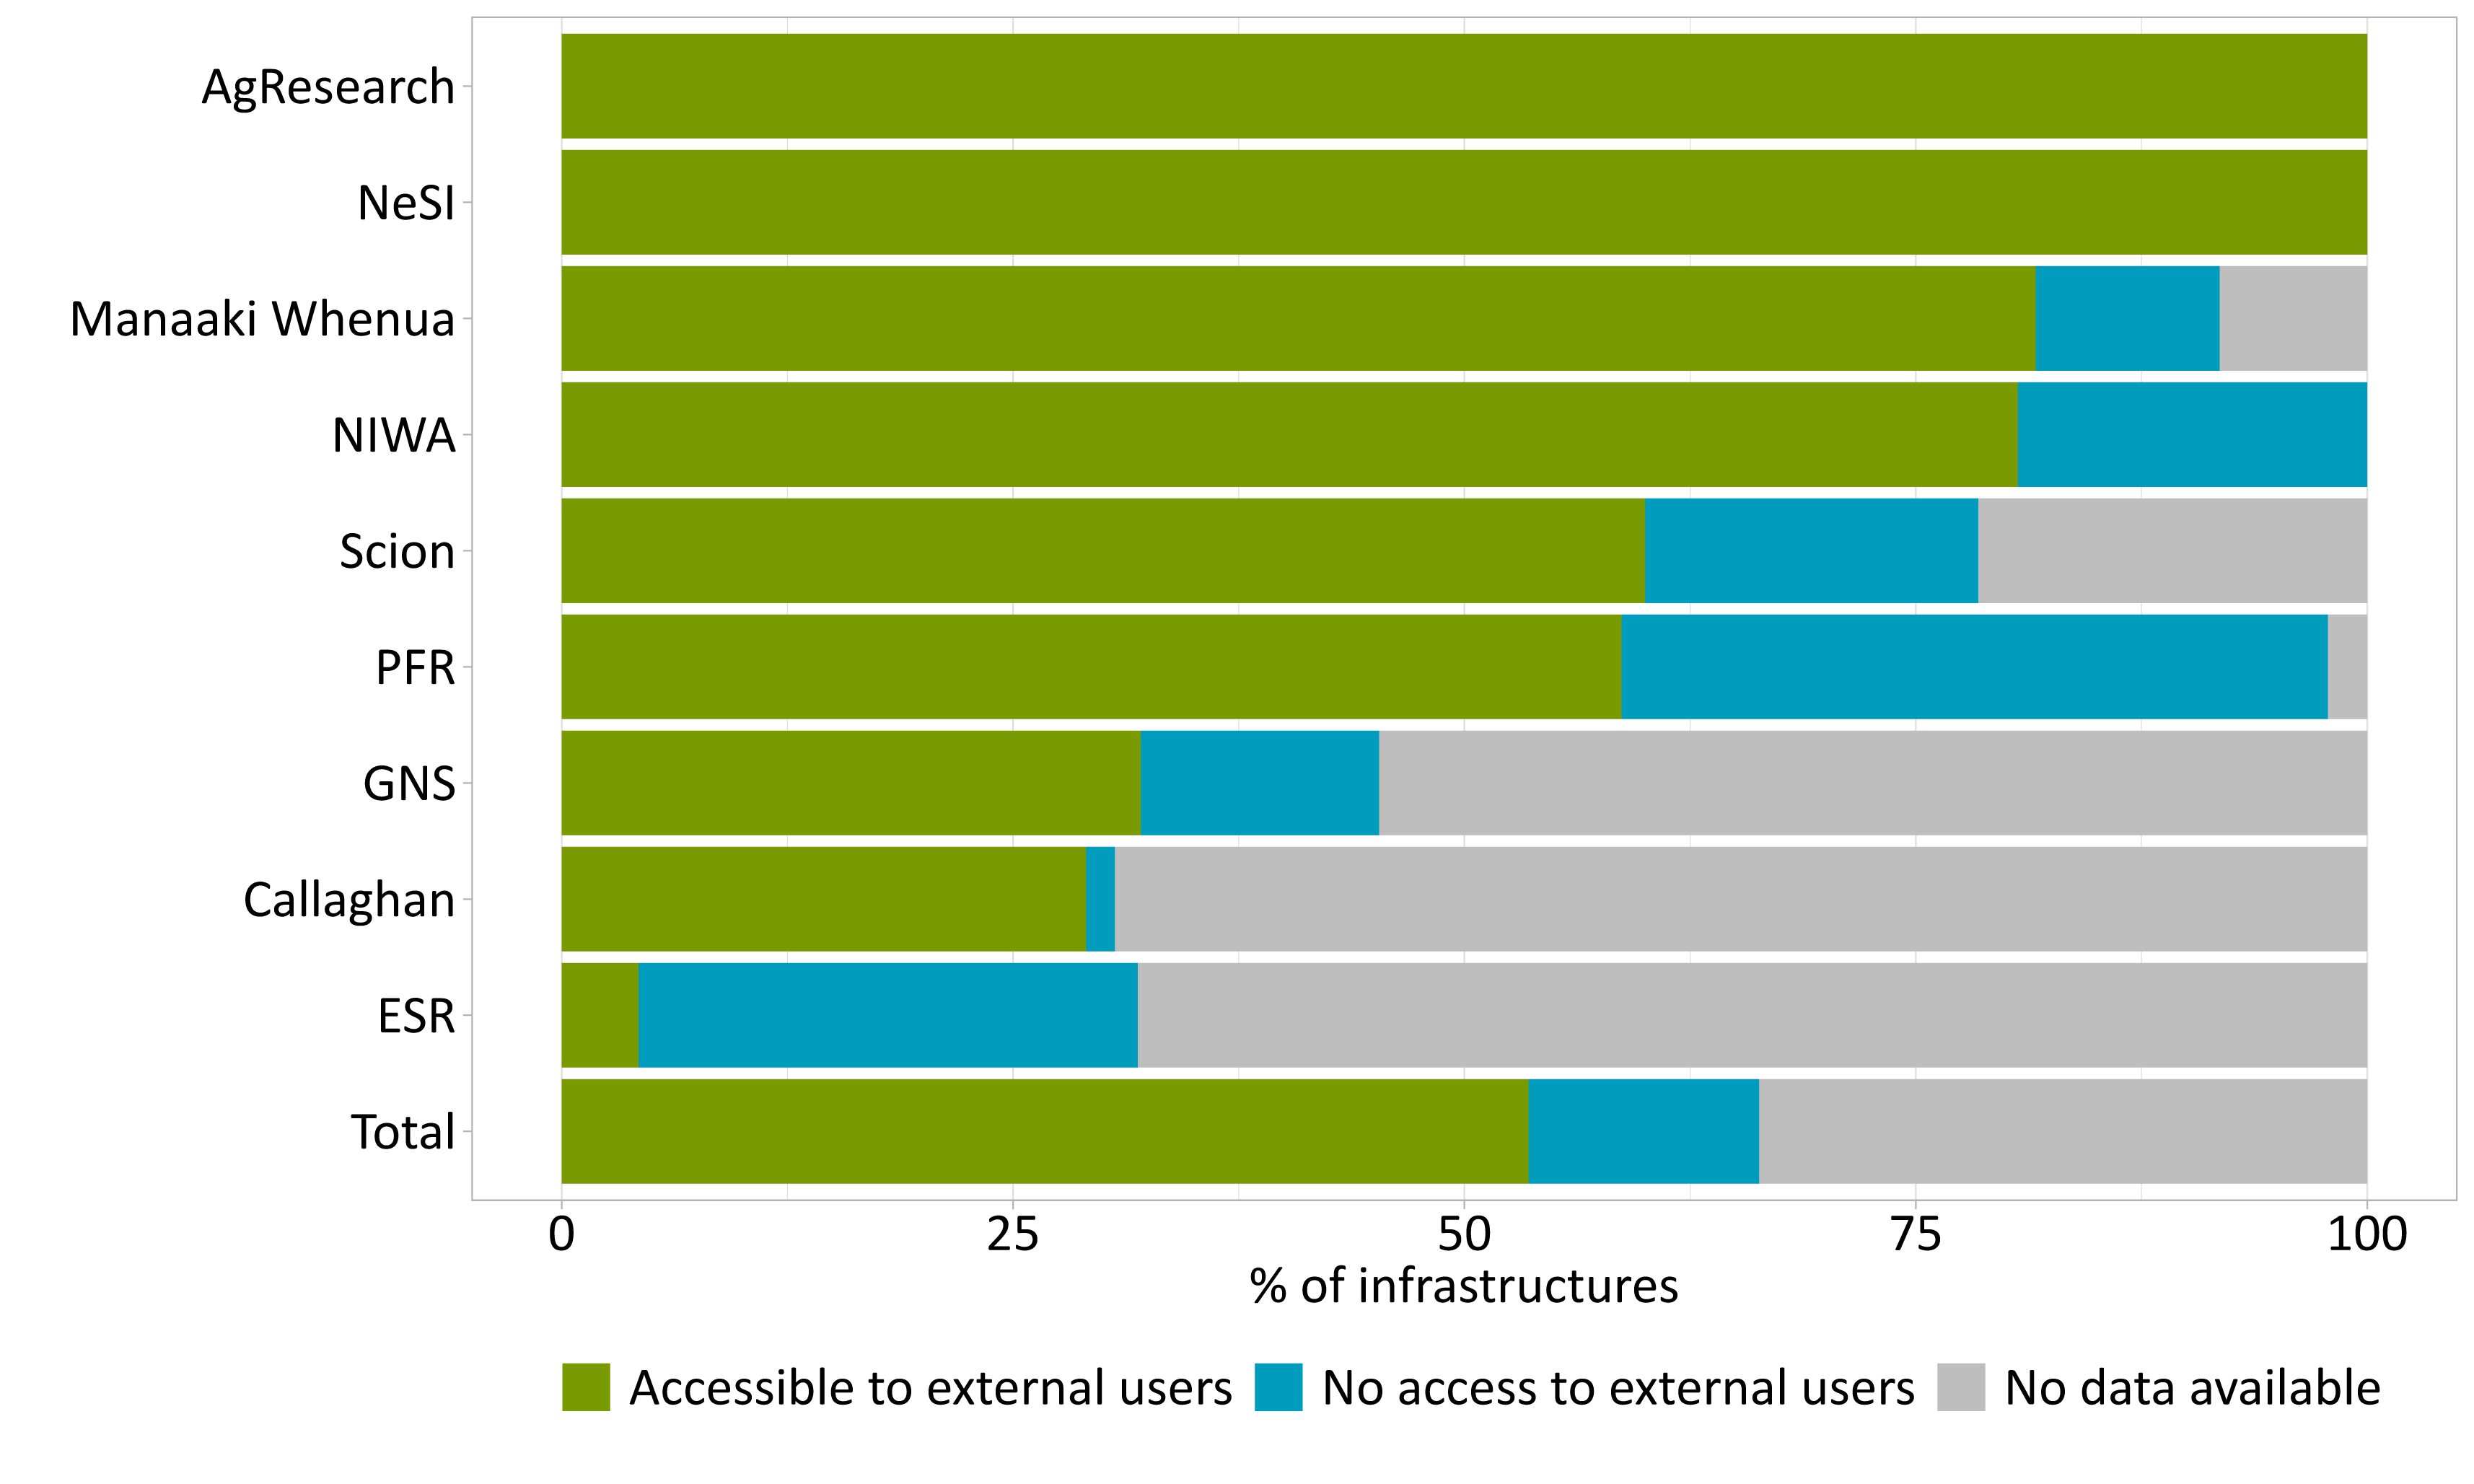
In Figure 7, survey data were reframed to the binary question: can the infrastructure be accessed by external users? This shows the proportion of each institution’s infrastructures with at least one mode of access that is available to external users. Of the 493 total infrastructures, 53% (264) were reported as being accessible to external users, with 13% (63) being inaccessible, and no data available for the remaining 34% (166) infrastructures. We note that there a range of reasons why some infrastructure is not available for wider use, including health and safety concerns, compliance/regulatory approvals, calibration requirements, current capacity limitations, or where security requirements restrict physical access.
Figure 7: Accessibility of research infrastructure to external users. More than half of research infrastructures are accessible to external users at most institutions*
*Data notes
Text description of figure
Metadata table (response rates)
The proportion of research infrastructures made available by the institutions to external researchers is highly dependent on the type of research it supports. For example, NeSI, as an eScience platform, develops its infrastructure entirely for the use of external users, which is reflected in 100% of its research infrastructure being accessible to external users. By contrast, ESR provides a significant number of services that are enabled by its infrastructures, including restricted services for government that precludes access by external users. This is reflected in ESRs low rate of accessible research infrastructure. PFR reported the highest fraction of infrastructures that are fully utilised internally and are inaccessible to external users, although the majority of its infrastructures (primarily laboratories and field sites) are externally accessible.
Modes of granting access to research infrastructure vary
Of the 264 infrastructures identified as accessible to external users in Figure 7, these can be further categorised in terms of the means by which access is granted to external users.
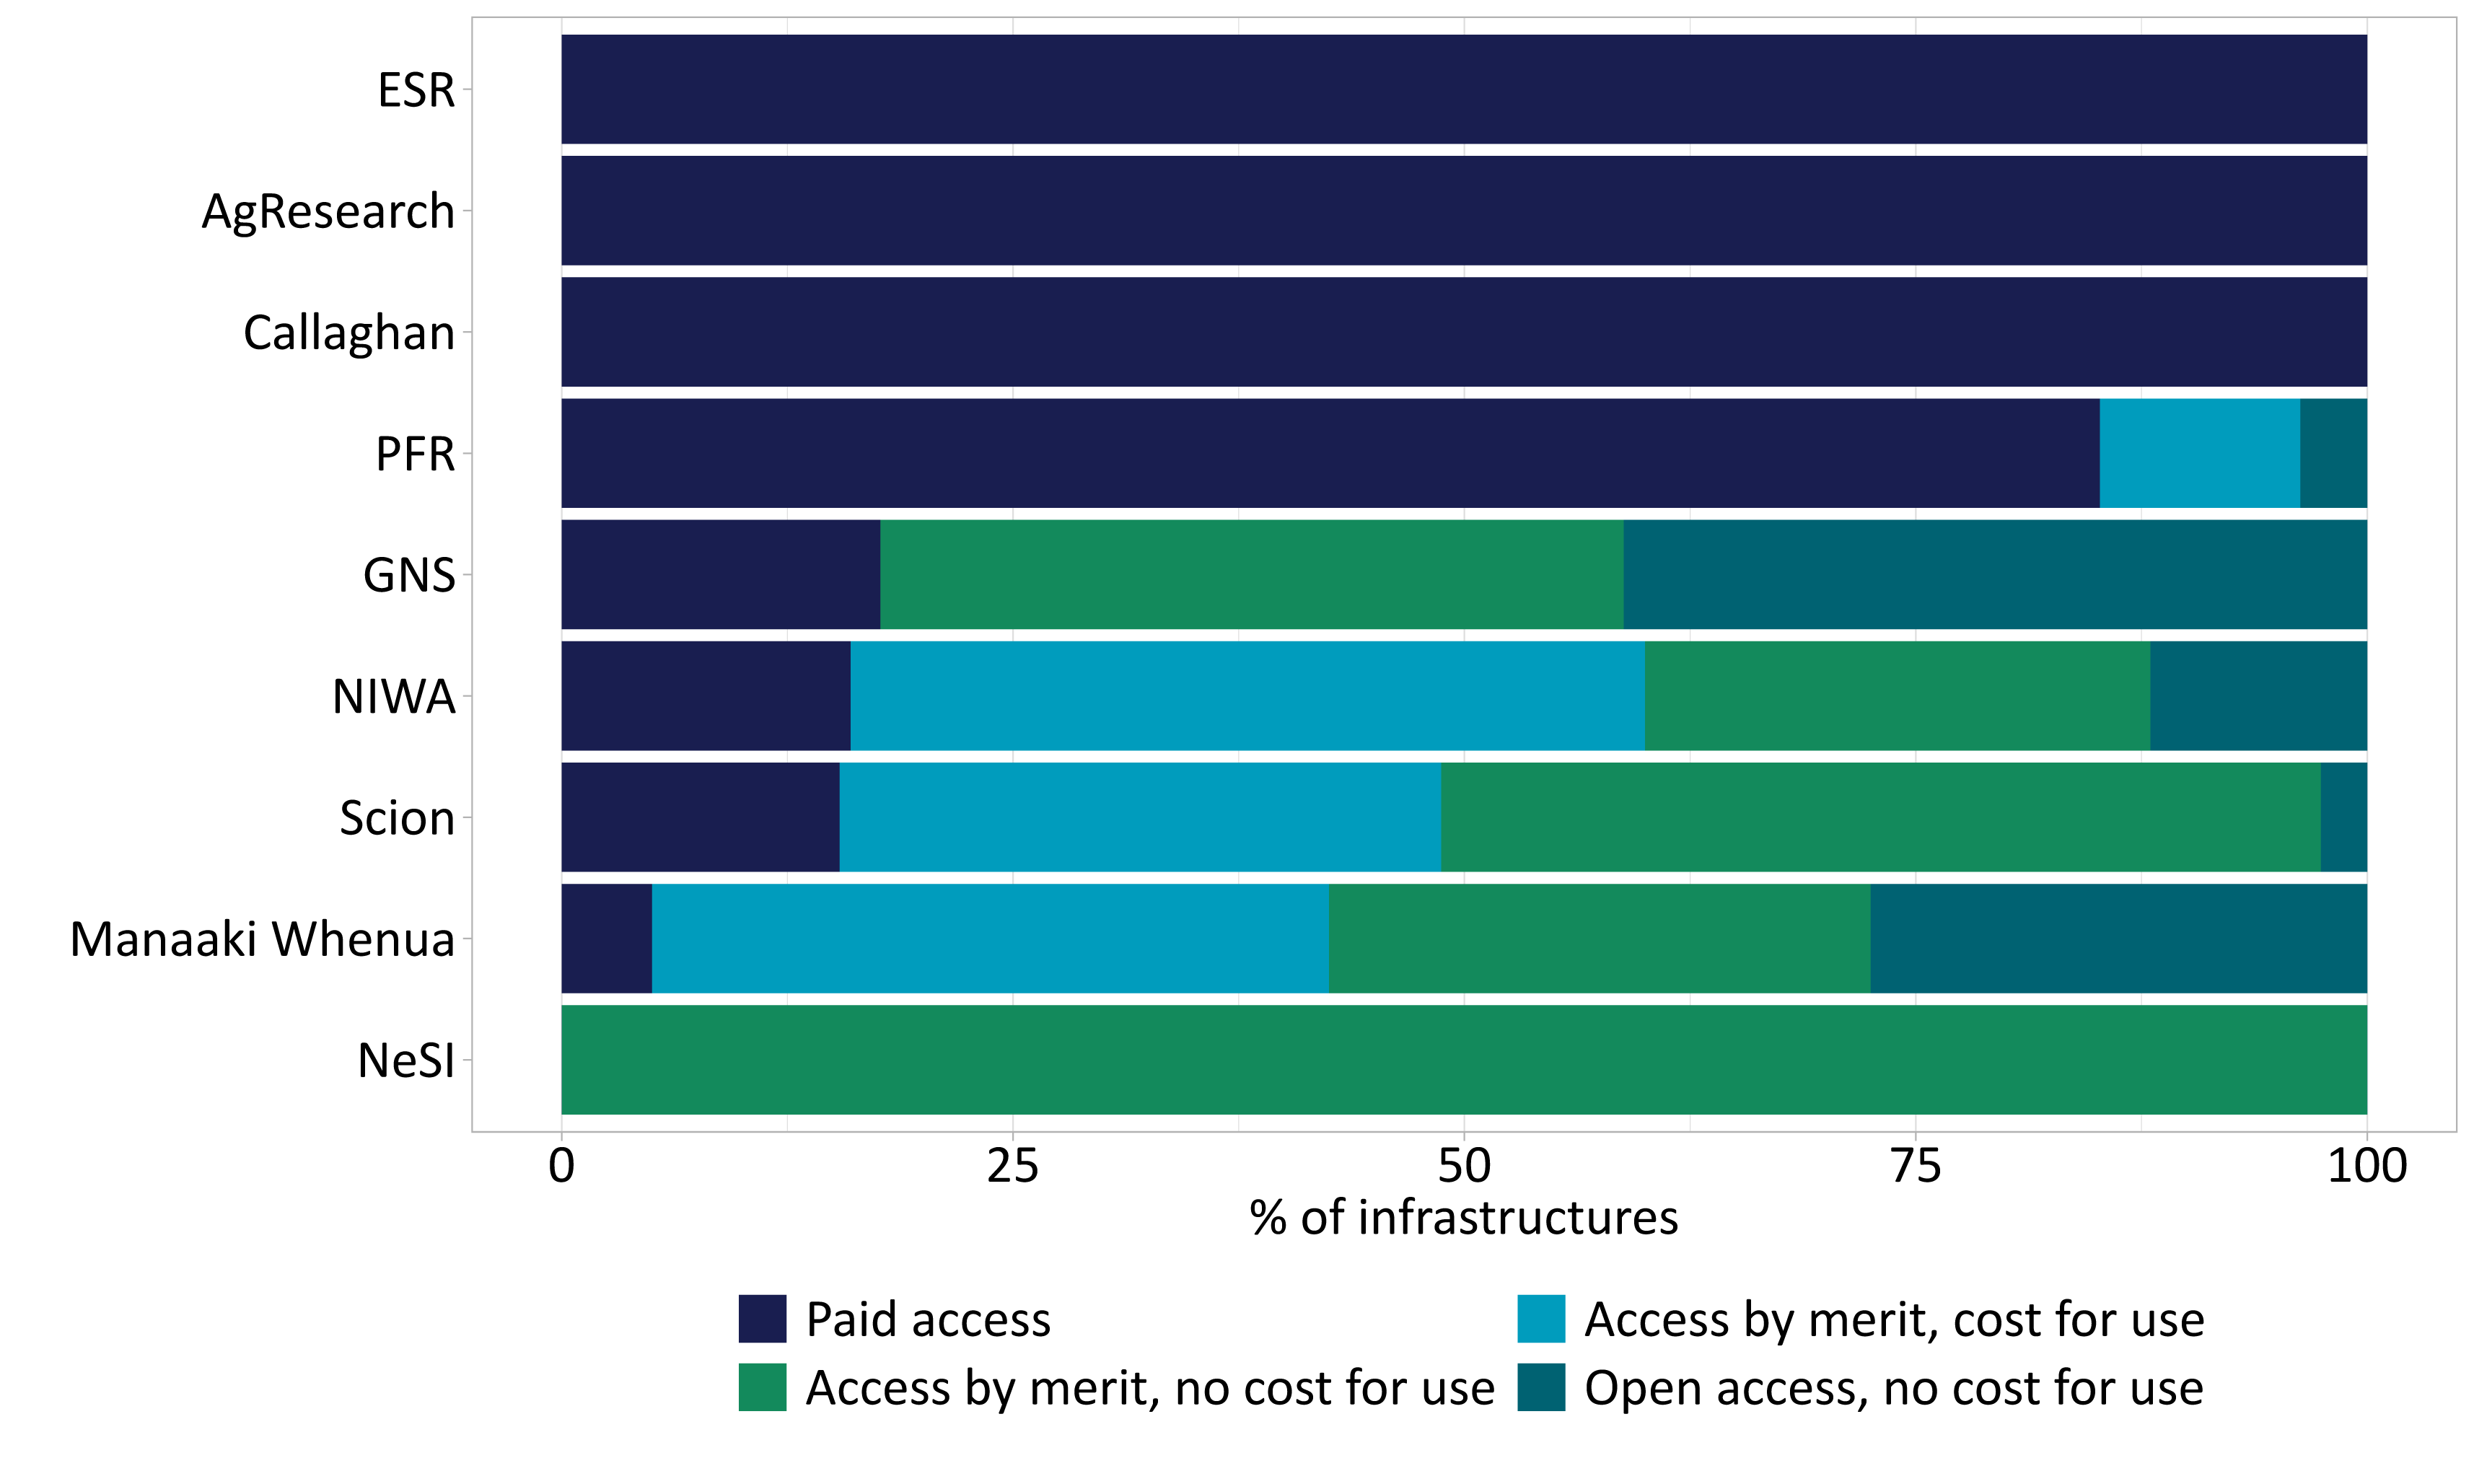
Figure 8: Primary means by which external users can access infrastructure at each institution*
*Data notes
Text description of figure
In Figure 8, survey data have again been simplified from more complex responses for clarity. Access is divided into 4 categories: fully paid access, access by merit for a cost, access by merit with no cost, and open access at no cost (Figure 8). We note that these describe costs to the external users – those infrastructures provided at no cost to external users may be at considerable costs to their host institutions.
Paid access is where an external user must pay a fee to access the infrastructure. This includes, but is not limited to, infrastructures accessed through commercial arrangements, those which require a fee, and those that are available as a service. Access by merit is where access is granted based on the specific research to be undertaken by the external user, and is further split based on whether there is a cost to the external user once access is approved. Access by merit for a cost can apply in situations, for example, where an assessment process is required before access to the infrastructure is approved. Access granted by merit for no cost is typically applied where there is limited capacity available or the specific resource requires approval to gain access, but there is no cost to users (eg NeSI). Finally, ‘open access, no cost for use’ is where any external user can access this infrastructure for no cost. In the Kitmap data this often includes, though is not limited to, digital resources such as databases and digital collections, which are available online.
Policies for access to infrastructures can be complex, and no uniform approach for connecting to and granting access to them exists across the institutions. In some cases, different access policies can apply for different resources within the same infrastructure, eg external users can only use machine A, while machine B is for internal use only. Another complicating factor is that in these data, external users include those accessing the outputs of the infrastructures, and not just the physical equipment. An example is how access to the outputs of GeoNet are available to all, but the sensor network itself is not. Furthermore, in some cases it is not the physical infrastructure that is limited, but the time of the support staff whose expertise is required to operate it.
7 of the 9 institutions have a significant percentage (between 40 – 100%) of reported infrastructures that are available at a cost to users (ie paid access or merit access with cost; Figure 8). We note that cost recovery through access charges for external users can be entirely appropriate, and that this does not necessarily imply that the infrastructure costs are fully met through these fees.
The highest percentages of open access infrastructures are at GNS and Manaaki Whenua (Figure 8), which reflects their significant number of online databases (Figure 3), a number of which are funded by MBIE to provide open access. GNS, Scion, Manaaki Whenua, NIWA, and NeSI each have a significant proportion of infrastructures (25 – 100%) that can be accessed by merit for no cost (Figure 8). For NeSI, this represents the entirety of its infrastructure, and reflects the nature of the organisation.
Data on the criteria for merit basis for access was not collected in the survey, although some of the institutions outline their access policies online (eg NeSI[11]). The mechanisms for assessing merit-based access likely vary significantly across the institutions, but include review processes through online portals, specific institutional committees, or infrastructure managers. Internationally, access assessment approaches often include consideration of academic merit, expertise in the field, and, where necessary, competency to operate the specified infrastructure.
Organisations reported almost 5000 users across their research infrastructure
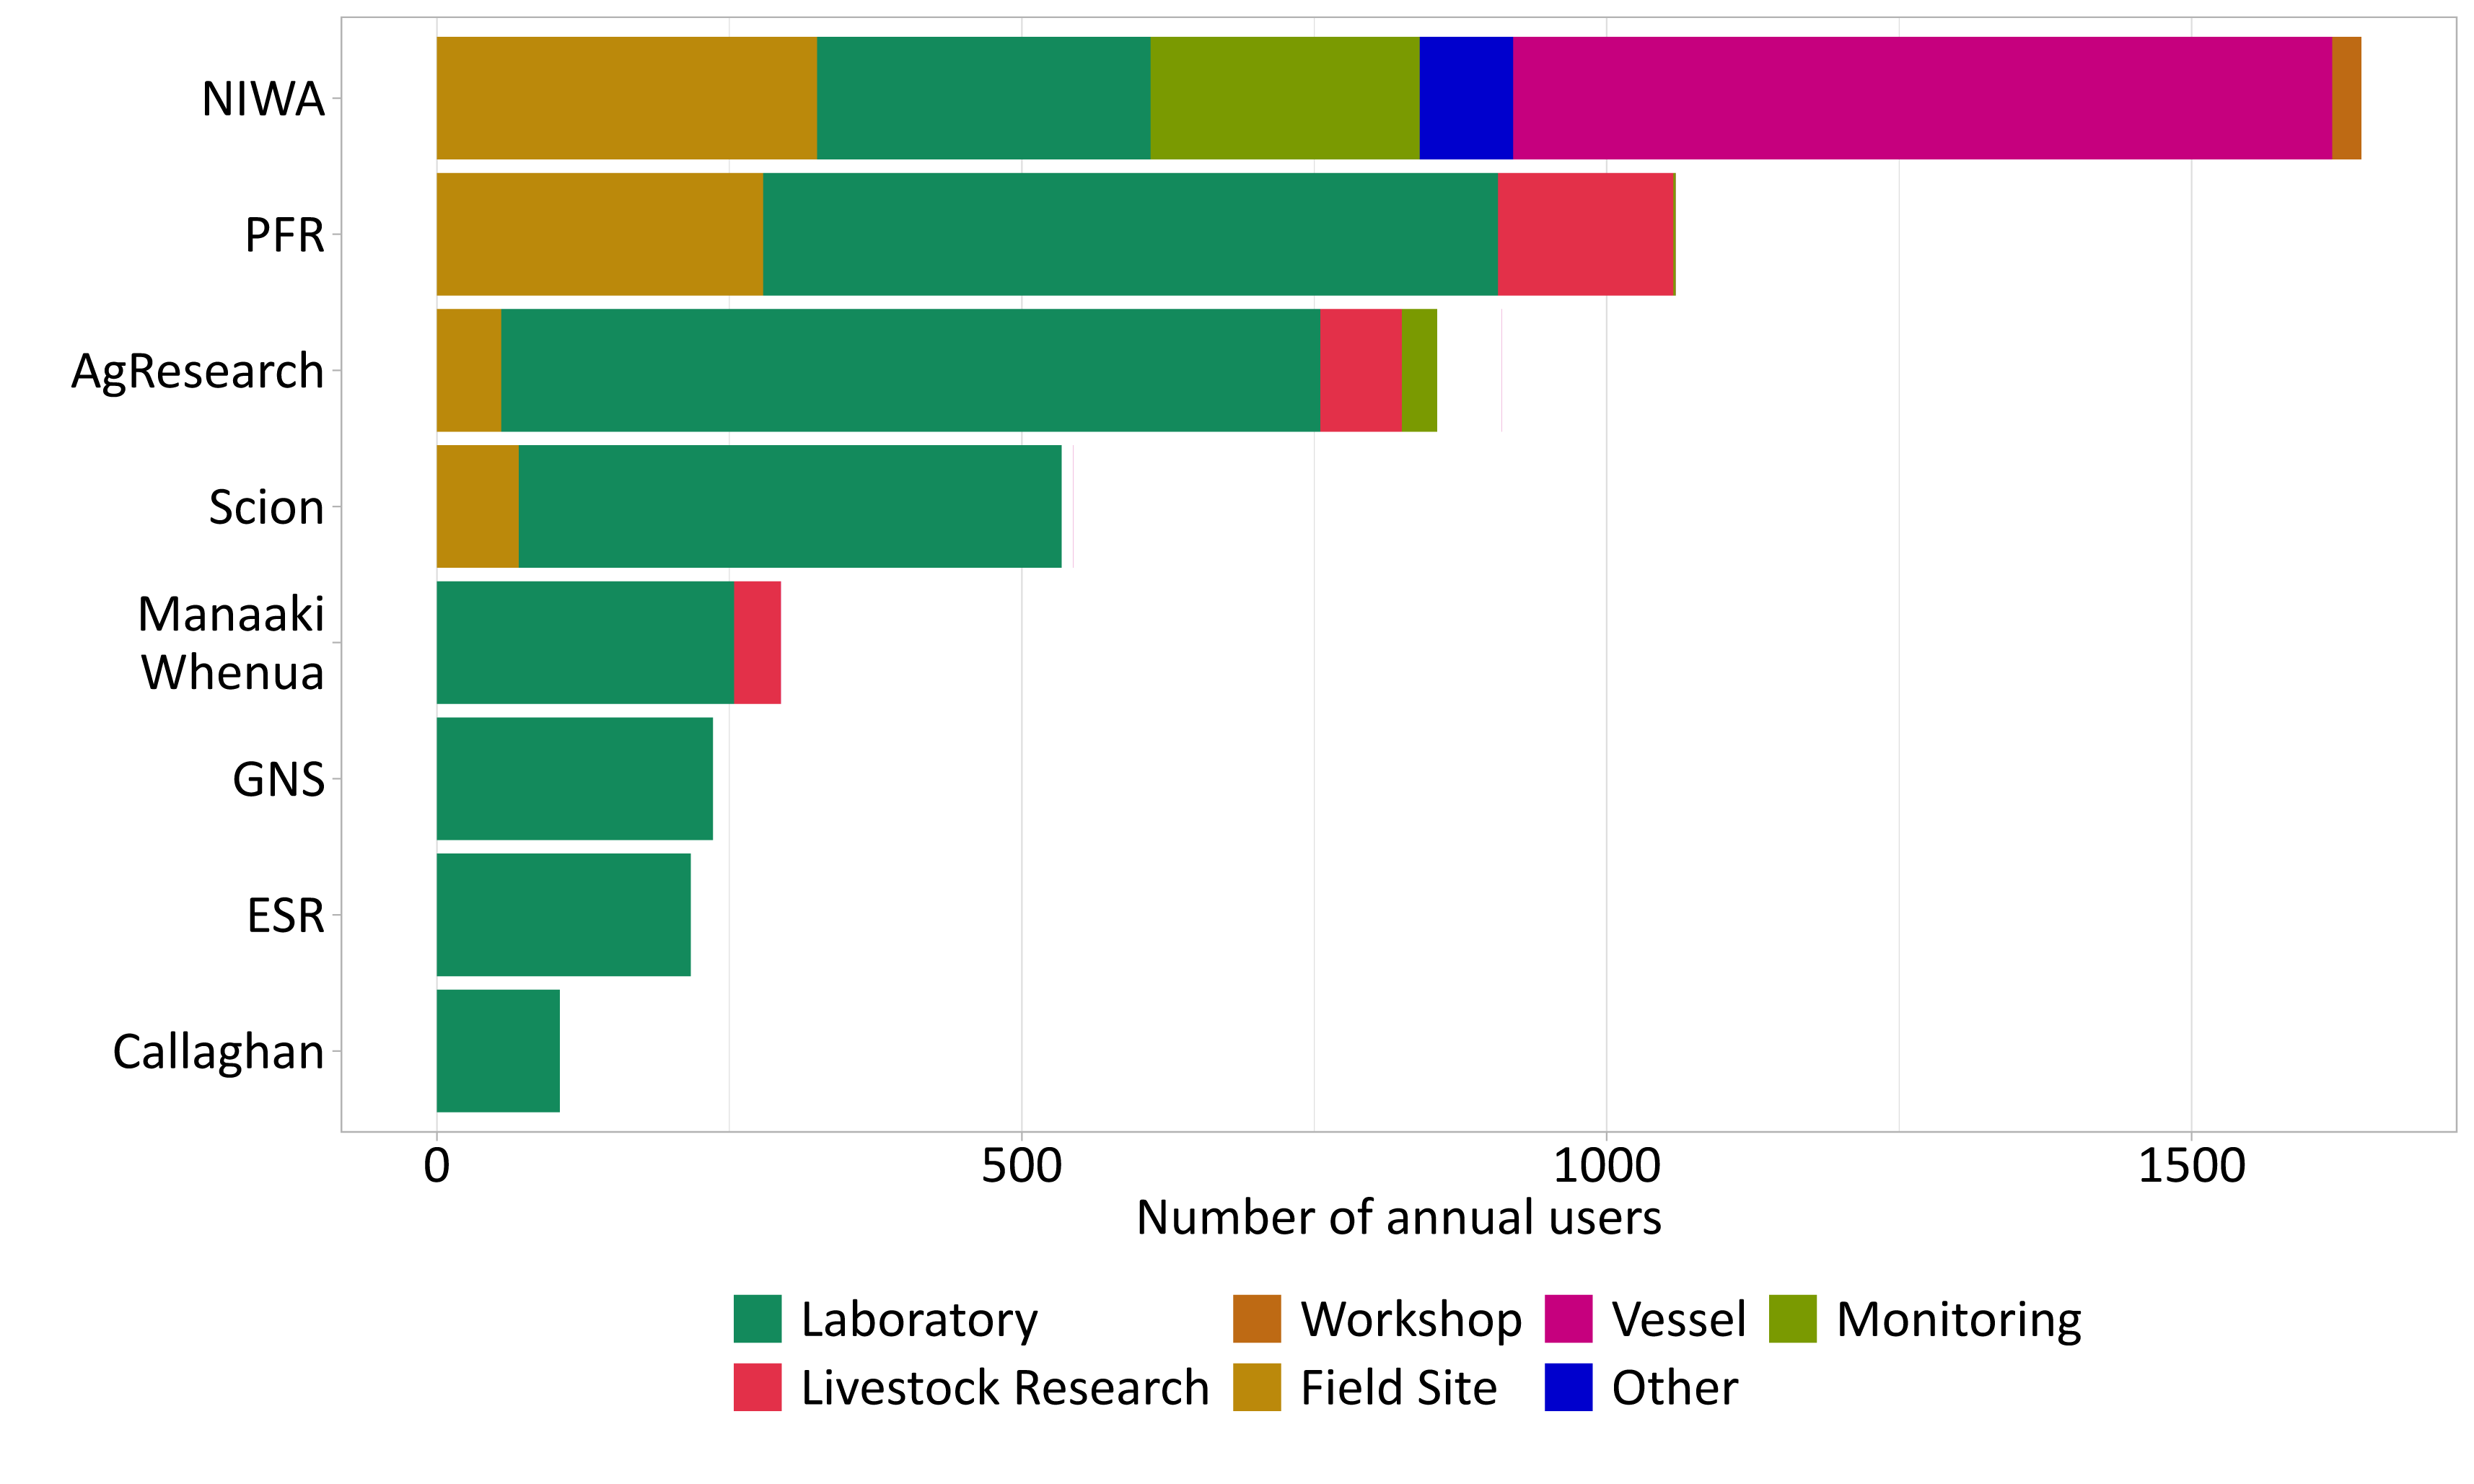
Understanding who is using research infrastructure and how they are using it is a key part of characterising our research infrastructure portfolio and whether/how it is meeting the needs of researchers. In Figure 9 we analyse the total annual users of research infrastructures reported by the institutions, categorised by type of infrastructure. We note that here users are not limited to those who are physically interacting with infrastructures (ie researchers), but also include the direct users of the outputs from those (eg government departments).
Figure 9: Annual users of research infrastructure Those infrastructures with (comparatively) unlimited capacity (i.e., computing, sample and digital collections) are excluded*
*Data notes
Text description of figure
Metadata table (response rates)
Here, annual users includes both internal and external users. Nine individual infrastructures with significantly higher user counts were excluded from Figure 9, which comprised sample collections, digital collections, and computing infrastructure that have different capacity limits from other infrastructures. For example, whereas a laboratory or instrument can only have a certain number of users at one time, a website or database has essentially unlimited capacity. For that reason, those high-capacity infrastructures (including all NeSI infrastructures) were excluded. This approach is most useful for understanding the usage, capacity, and availability of research infrastructures in Aotearoa.
Across the institutions, the main infrastructure usage is for laboratories (Figure 9). This is perhaps unsurprising, as laboratories are a fundamental part of many areas of scientific research, and for the same reason, laboratories are the most abundant type of infrastructure across the institutions (Figure 3). The relative abundance of laboratory users for some institutions is also partly due to laboratories being their only infrastructures with user statistics. While the users within these reflect access to a wide variety of different types of resources, the data do not readily allow further comparison at that level.
The greatest diversity of research infrastructure types accessed by users occurs at NIWA, with users across 6 types of infrastructure. A significant fraction of NIWA’s users are across its research vessels, reflecting the high demand for those infrastructures, as well as their large-scale and uniqueness in the Aotearoa infrastructure portfolio.
Government agencies and other CRIs are primary external users of research infrastructure
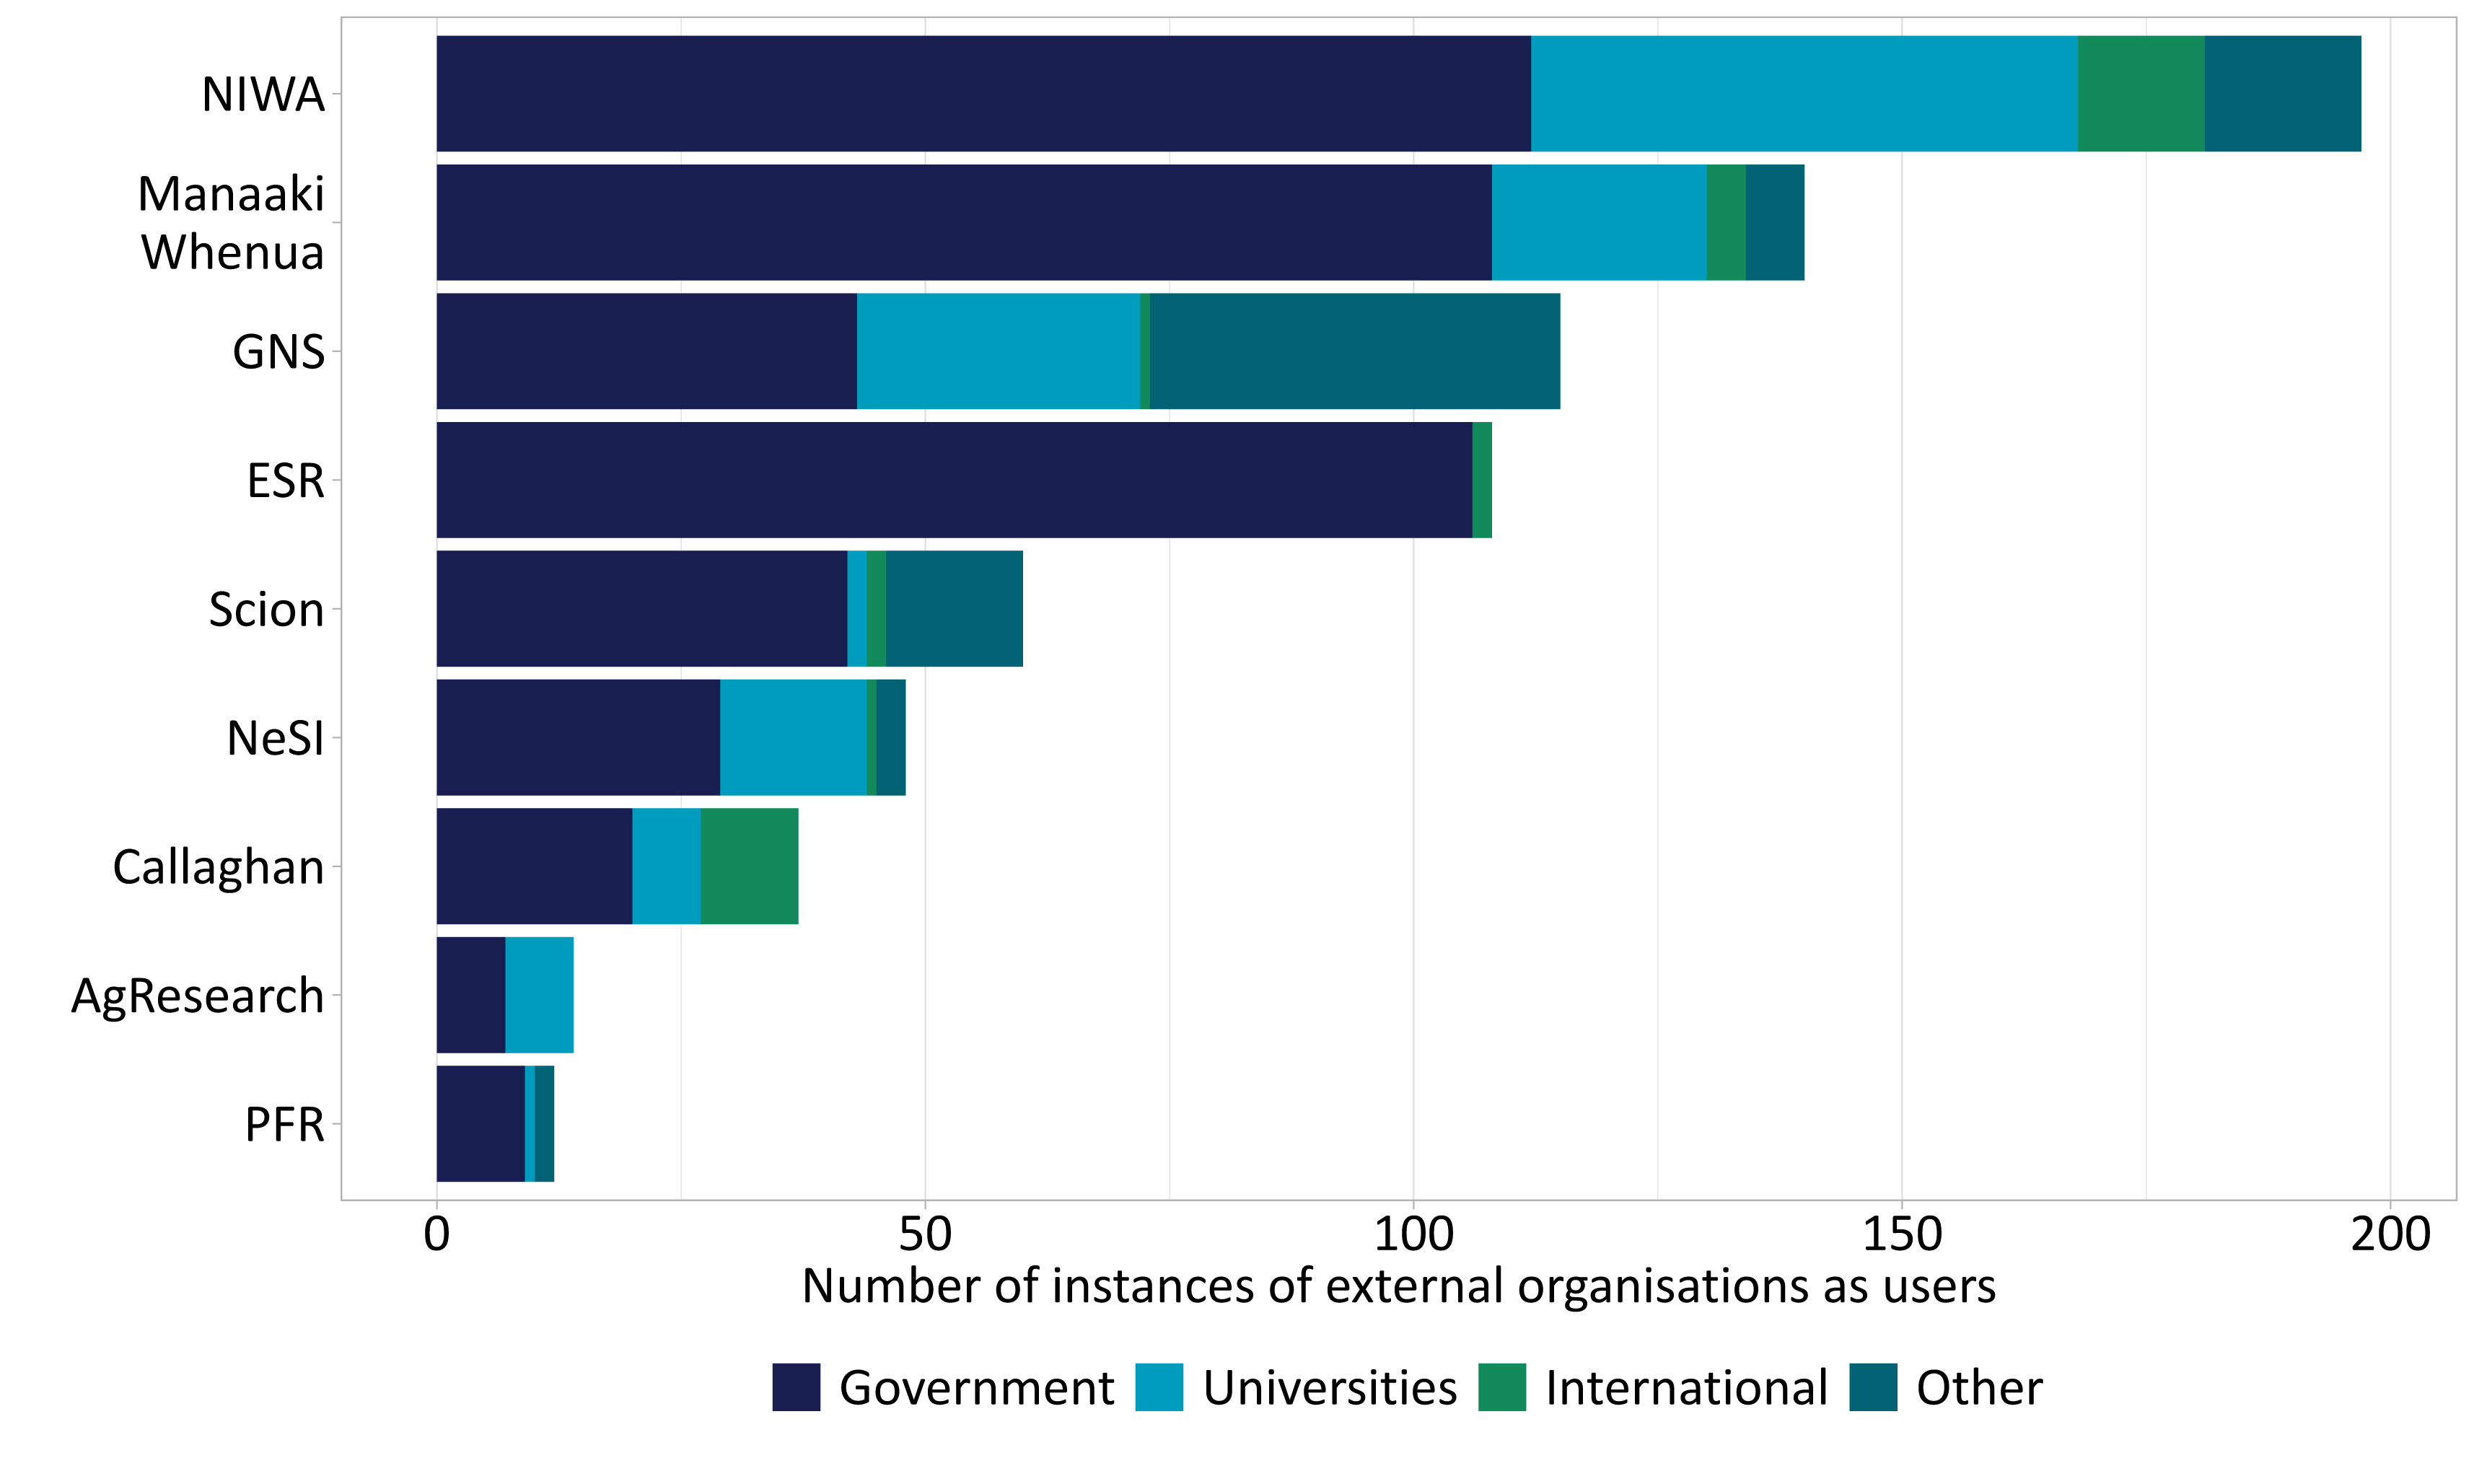
Figure 10 and Figure 11 represent where the external users of infrastructure are from, with Figure 10 showing these by sector, and Figure 11 giving the details of government organisations as users of research infrastructure. Note that in both cases, these reflect the number of times an organisation was listed amongst the users, not the actual count of individuals directly using the infrastructure (which is shown in Figure 9).
Figure 10: Number of instances of external organisations listed as infrastructure users at each institution, grouped (broadly) by sector. Government organisations (including CRIs) make up a large proportion of external users of research infrastructure*
Text description of figure
*Data notes
Figure 11: Number of times government organisations were listed amongst the users of research infrastructure. This shows who are the major external users of research infrastructure across government organisations*
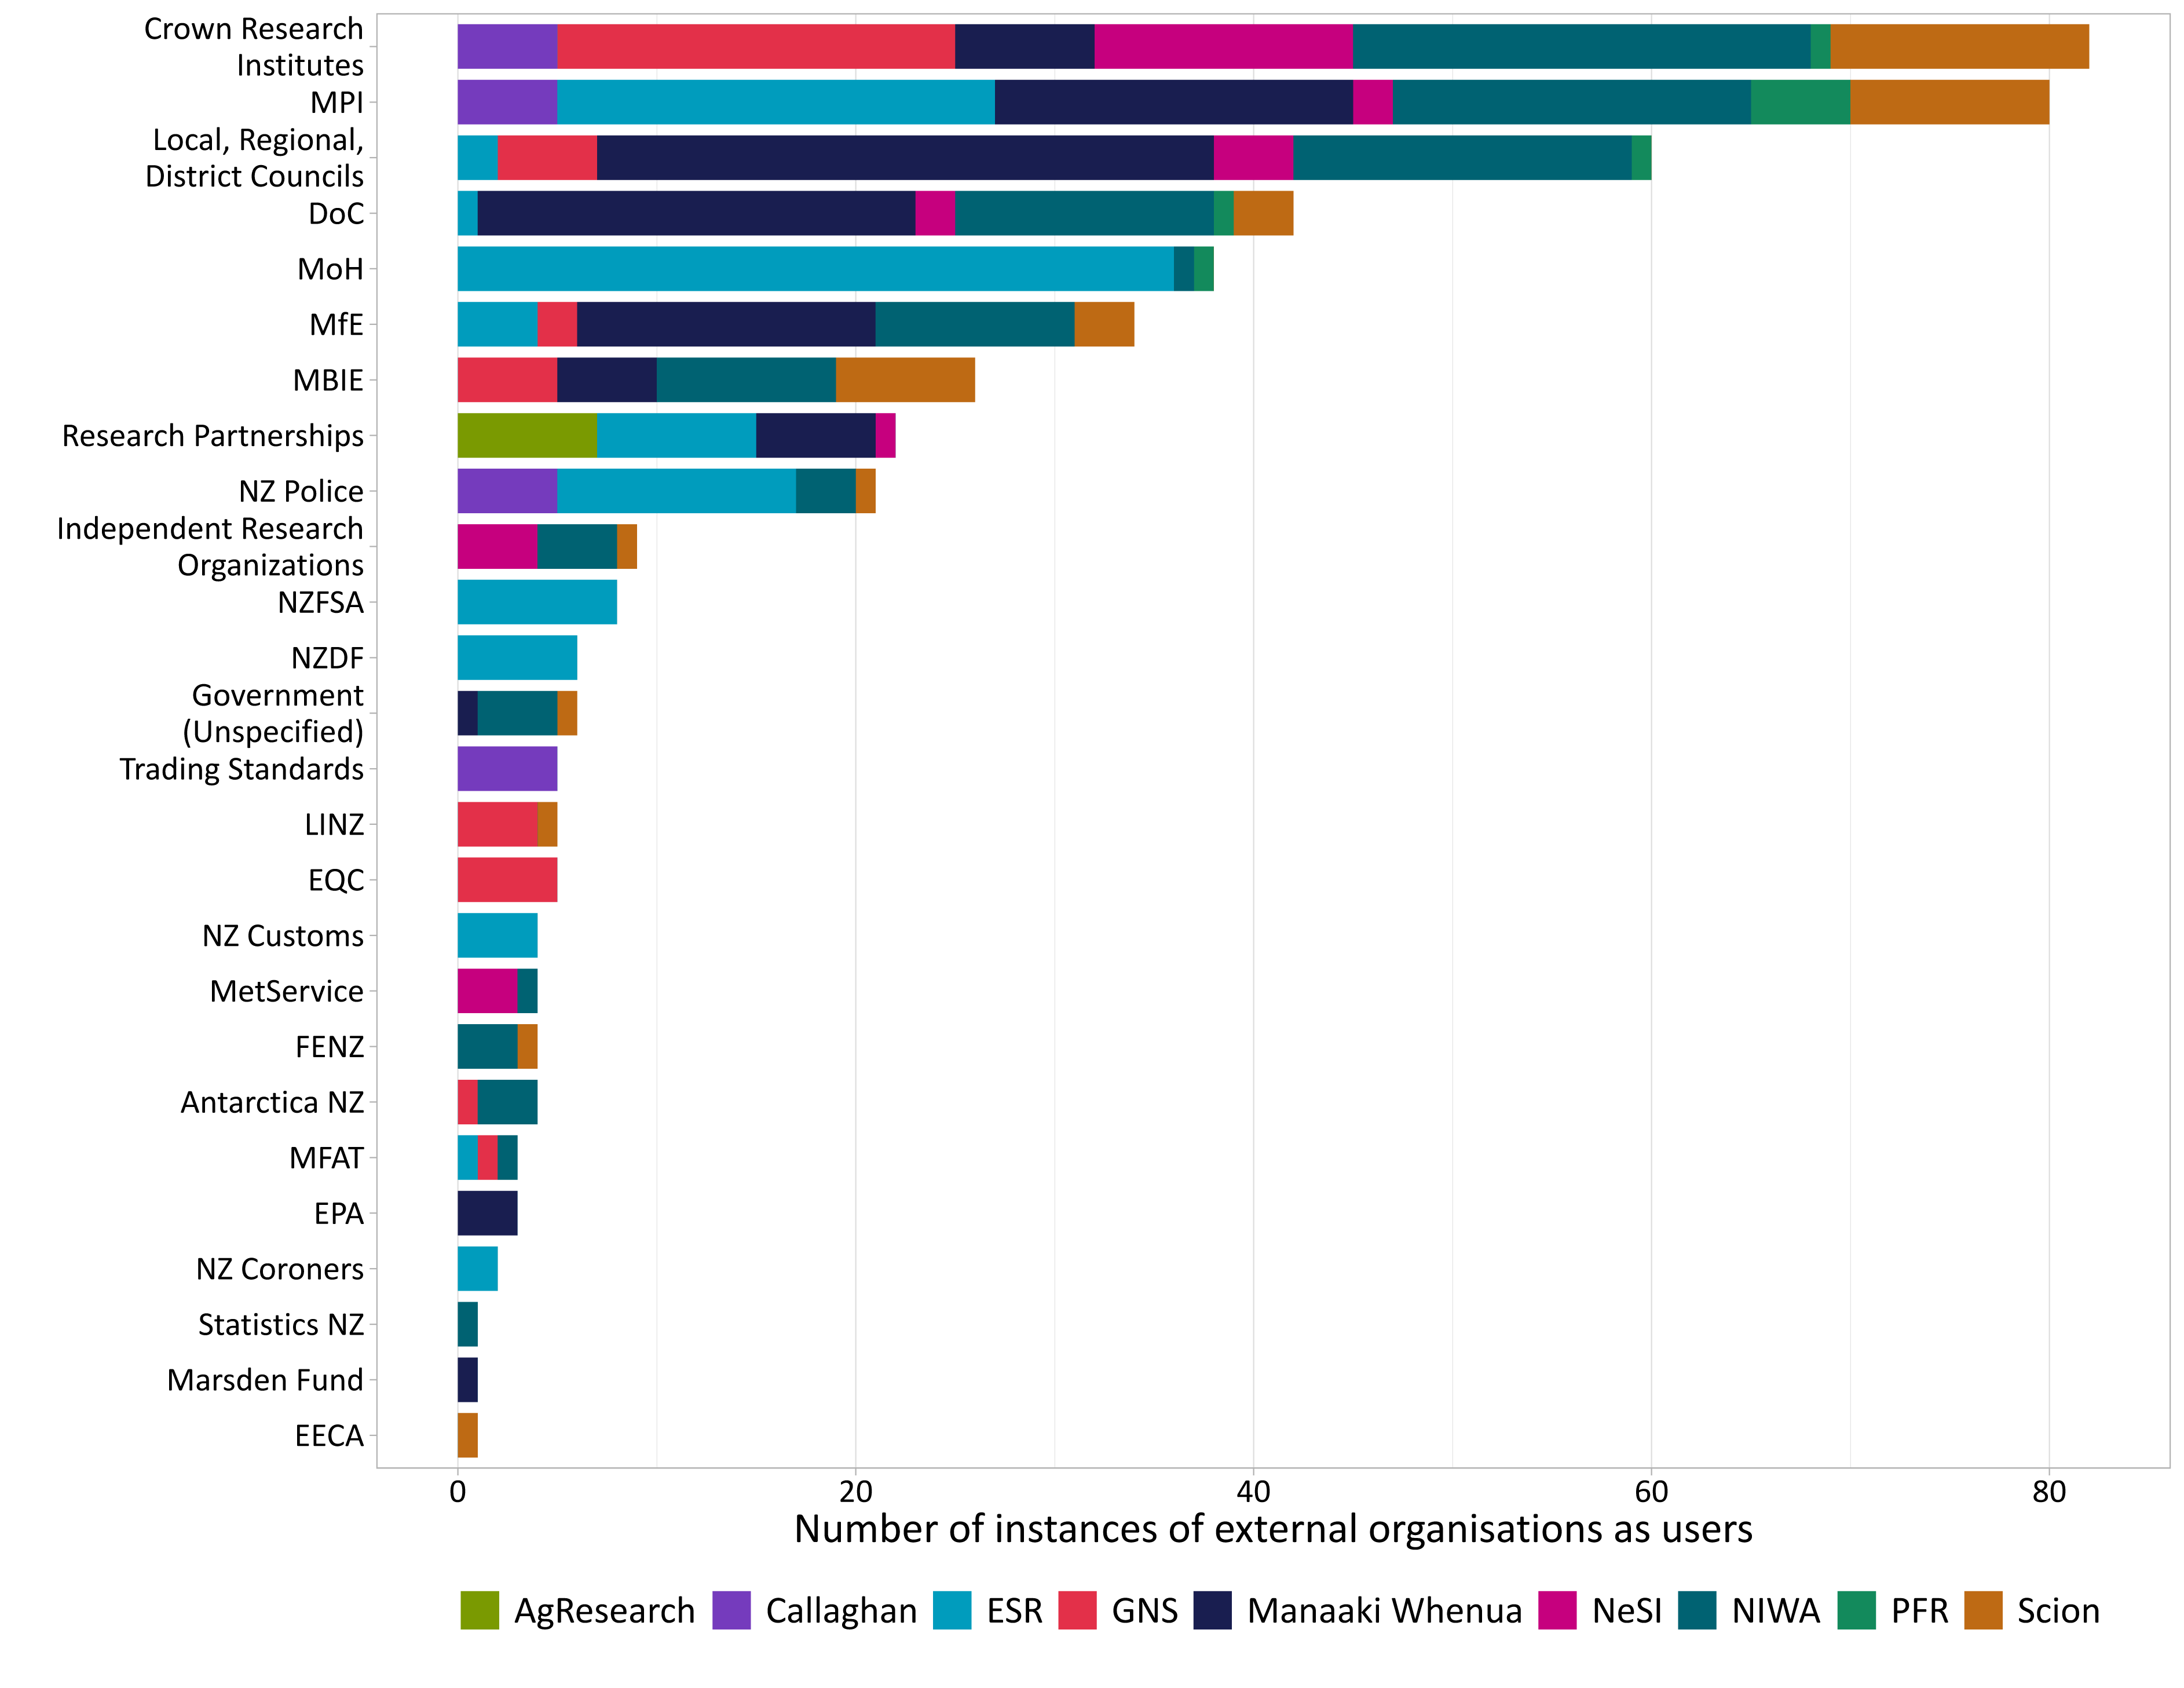
*Data notes
Text description of figure
Metadata table (response rates)
Together, Figure 10 and Figure 11 demonstrate that the majority of the institutions have a diverse range of external users of their infrastructure, and that all carry out a variety of functions that support both the government and research sectors.
Figure 10 highlights that the government sector represents significant use of research infrastructure across the institutions. These government users are spread across several different organisations, as shown in Figure 11.
Figure 11 shows that across the institutions, the most common grouping of external users of research infrastructures are from other CRIs. This reveals a high level of cooperation between the institutions, even if this is not coordinated centrally. Other significant government users include local and regional councils, government ministries, and range of government departments. These reflect the large number of government services and critical functions that are enabled by research infrastructure held by the institutions, and the strong demand for the scientific research they enable.
Staff support for research infrastructure
Part of the gap in our knowledge of the RSI system that the Kitmap project aimed to address is how well our research infrastructure is supported. Technical staff are an integral part of the operation of research infrastructure, without whom the value of infrastructure investments cannot be fully realised. The Kitmap survey collected some basic information about the total specialist staff, in terms of fulltime equivalents (FTE), that are allocated for the operation and maintenance of the infrastructures.
Across the 149 infrastructures where staffing information was provided, institutions identified 529.24 FTE of supporting staff. Table 3 looks at the statistics of the FTE data reported in the survey, and how the FTE values relate to the number of infrastructures and resources across the institutions.
Table 3: Average FTE per infrastructure and resource at each institution*
|
|
AgResearch |
GNS |
Manaaki Whenua |
NIWA |
PFR |
Scion |
Total |
|
FTE per infrastructure |
|||||||
|
Infrastructures with FTE data |
17/62 (27%) |
16/53 (30%) |
30/49 (61%) |
22/31 (71%) |
40/46 (87%) |
24/65 (37%) |
149/493 (30%) |
|
Average FTE per infrastructure with data |
2.11 ± 1.17 |
2.63 ± 3.37 |
1.51 ± 2.25 |
7.81 ± 9.71 |
4.83 ± 5.65 |
1.70 ± 2.72 |
3.55 ± 5.49 |
|
FTE per resource |
|||||||
|
Infrastructures with resource and FTE data |
17/62 (27%) |
10/53 (19%) |
5/49 (10%) |
14/31 (45%) |
33/46 (72%) |
17/65 (26%) |
96/493 (19%) |
|
Average FTE per resource with data |
1.34 ± 1.18 |
1.02 ± 2.12 |
0.56 ± 0.59 |
0.70 ± 0.41 |
1.70 ± 1.98 |
0.47 ± 0.33 |
0.97 ± 1.10 |
*Data notes
The FTE per infrastructure in Table 3 represents the average number of staff support assigned per infrastructure (excluding those for which no FTE data were provided), which could be, for example, a laboratory or facility. The FTE per resource represents the number of staff support per significant piece of equipment, such as large scientific instruments. We note that these averages do not account for the different scales of the infrastructures and resources they encapsulate. For example, larger scale infrastructures or resources with greater numbers of staff support could significantly raise the average value, while large numbers of smaller infrastructures or resources will lower the average Table 3.
The large variations in per infrastructure values at both the institutional level and overall indicates that research and technical staff are not evenly distributed between infrastructures.
The variability in FTE on a per resource basis is much smaller than per infrastructure, which suggests that number of staff scales with the sizes of the infrastructures. Across the institutions, there is typically around 0.5 to 1 FTE allocated per significant piece of equipment.
[11] Access Policy | New Zealand eScience Infrastructure(external link) — NeSI