Key domestic RTI data tables
This page has graphs and tables that show changes in domestic expenditure, using April 2016 data.
On this page
About the data
The information contained in the following graphs and tables is in index form. The index reports spend compared to the average month in 2008, which is defined as 100. A value of 110 for an index means spend is 10% above the 2008 average.
See About the Regional Tourism Indicators (RTIs) for more information.
Graph 1: Total domestic spend for whole country
The average domestic index for the 12 months ending April 2016 was 114, representing a 14% increase compared with 2008. The April 2016 index was slightly lower than in April 2015.
There were mixed results in the regional tourism organisations (RTOs). 16 RTOs showed moderate increases in domestic spend, while 11 had declines when compared with April 2015.
The strongest growing RTOs were:
- Queenstown RTO (up 9%)
- Bay of Plenty RTO (up 6%)
- Nelson Tasman RTO (up 4%).
Graph 2: Monthly spend index
Total domestic, last 3 months
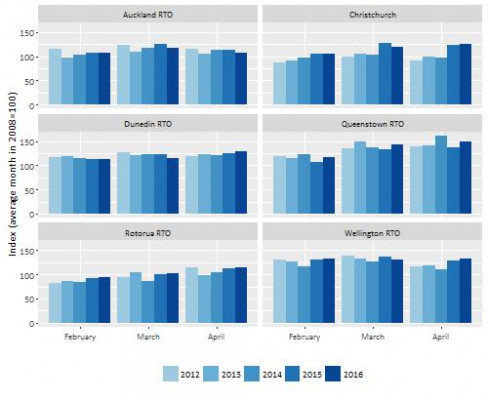
Table 1: Monthly spend index
Total domestic, annual percentage change from April 2015 to April 2016
|
Period |
April 2015 |
April 2016 |
Annual percentage change |
|
Auckland RTO |
114 |
107 |
-6% |
|
Christchurch |
124 |
125 |
1% |
|
Dunedin RTO |
126 |
129 |
3% |
|
Queenstown RTO |
137 |
149 |
9% |
|
Rotorua RTO |
113 |
115 |
2% |
|
Wellington RTO |
128 |
132 |
3% |
This table shows the April 2015 and April 2016 indexes from Graph 2.
Table 1 shows the total domestic spending over the last year increased in the Queenstown RTO (up 9%).
The historical monthly series for the domestic RTIs by RTO and territorial authority are available for download below:
Table of total domestic RTI by Regional Tourism Organisation [XLSX, 114 KB]
Table of total domestic RTI by Stats NZ Territorial Authority [XLSX, 337 KB]
Note: Territorial authority (TA) Indexes, particularly for small TAs, are more volatile than RTO indexes and should be used and interpreted with caution.
Core tourism goods and services
For domestic spending, the rolling average core tourism goods and services index for the 12 months ending April 2016 was 103 — that is, 3% above the average spend in 2008. There was a fall of 2% in domestic spending on core tourism goods and services for all New Zealand, with April 2015 and April 2016 showing an index of 109 and 107 respectively.
6 RTOs had higher domestic core tourism spending for April 2016 compared with April 2015, while one was unchanged, and 24 had lower core domestic spending.
The strongest growing RTOs in April 2016 were:
- Queenstown RTO (increased 8%)
- Wellington RTO (increased 7%).
The RTOs with the greatest decline in April 2016 were:
- Ruapehu RTO (down 36%)
- Lake Wanaka RTO (down 13%)
- Central Otago and West Coast RTOs (down 9%).
For a full list of contributing ANZSIC categories, see the definitions table.
RTI definition tables [XLSX, 74 KB]
The historical monthly series for the domestic RTIs for tourism goods and services by RTO are available for download below:
For breakdowns by country of origin see RTI detailed data.