Regional Tourism Indicators detailed data
From this page you can access tables that show a breakdown of international and domestic spending by regional tourism organisations.
On this page
RTI data
The information contained in the following tables is in either indexes or counts of transactions. An index represents changes in spend compared with the average month in 2008 (monthly index) — being equal to 100. This means that a value of 110 for an index means that there is a 10% increase in spend above 2008 for that month. Transaction counts are designed to provide an estimate of volume of activity.
See About the Regional Tourism Indicators (RTIs) for more information.
International RTIs
The following information refers to the April 2016 data.
Pivot table of international RTI by RTO region by the top countries visiting [XLSX, 6.6 MB]
Pivot table of international RTI by RTO region by industry [XLSX, 2.3 MB]
Domestic RTIs
The following information refers to the April 2016 data.
Pivot table of domestic RTI by RTO region by the top regions visiting the area [XLSX, 4.3 MB]
Pivot table of domestic RTI by RTO region by industry [XLSX, 2.4 MB]
Graph 1: International spend index for top 5 markets and RTOs
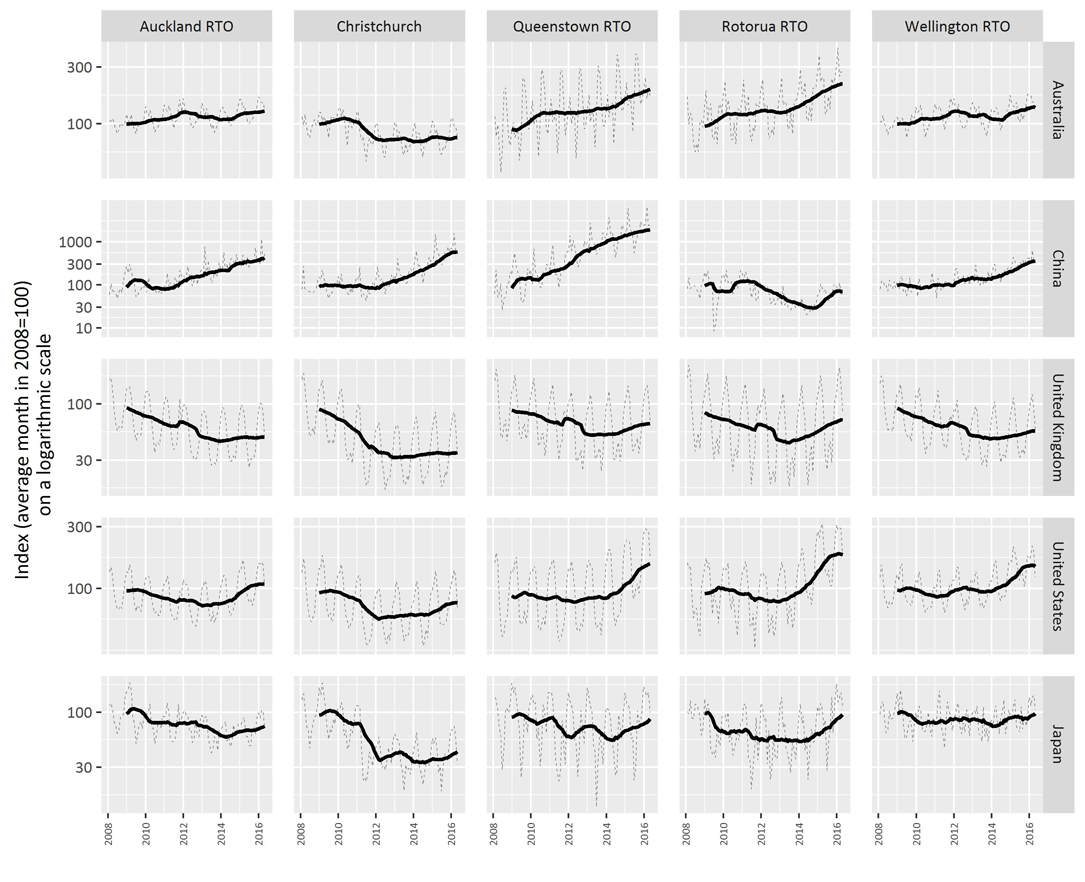
The information contained in Graph 1 is the monthly index (dotted line) and 12-month rolling average index (solid black line) for electronic card spend for the top 5 markets in our featured RTOs.
The last 12 months has seen a continued increase in Chinese and Japanese tourism spending across all 5 markets, with Chinese spending increasing by 84% in Auckland RTO, and Japanese spending increasing by 77% in Queenstown RTO.
Table 1: International spend index for top 5 markets and RTOs — Annual percentage change from April 2015 to April 2016
|
Country |
Auckland RTO |
Christchurch |
Queenstown RTO |
Rotorua RTO |
Wellington RTO |
|
Australia |
7% |
4% |
16% |
4% |
-15% |
|
China |
84% |
32% |
36% |
4% |
40% |
|
United Kingdom |
2% |
4% |
6% |
-3% |
3% |
|
United States |
No change |
-11% |
11% |
-15% |
-23% |
|
Japan |
23% |
21% |
77% |
56% |
47% |
Note: The information in the table shows the annual percentage change from April 2015 to April 2016 for the top 5 countries shown in Graph 1. The information contained in Table 1 is based on annual percentage changes in the monthly index.
The information contained in Graph 1 above is the monthly index (dotted line) and 12-month rolling average index (solid black line) for electronic card spend for the top 5 markets in our featured RTOs.
The last 12 months has seen a continued increase in Chinese and Japanese tourism spending across all 5 markets, with Chinese spending increasing by 84% in the Auckland RTO, and Japanese spending increasing by 77% in the Queenstown RTO.