Our region’s workforce
On this page
Labour market overview
Qualification levels help to evaluate the economic opportunities and socio-economic status of workers in particular industries. Higher qualifications result in more stable and better paid employment outcomes that in turn contribute to improved long term wellbeing outcomes.
While our people have made progress in gaining more qualifications, much of this gain has been in entry level qualifications. Qualification level data21 indicates that our workforce is less skilled compared to the national position. We need to concentrate on bridging that gap. This will help to ensure that the higher wages paid for higher-skilled roles, for example, those within the public funded projects mentioned above, flow directly into our communities.
Northland Region economic profile(external link) — Infometrics
With almost as many people over the age of 15 currently not in the labour force, unemployed, or employed full time in lesser-skilled roles, we already have the latent capacity to fill many of the jobs that will be created in the future. One of our greatest challenges will be to engage these members of our community in meaningful learning and purposeful employment journeys.
Business and industry
When comparing Northland to the national economy, it can be seen that overall, our rohe has a much more diverse economy but has relative concentrations in the primary industries and the goods producing industries.
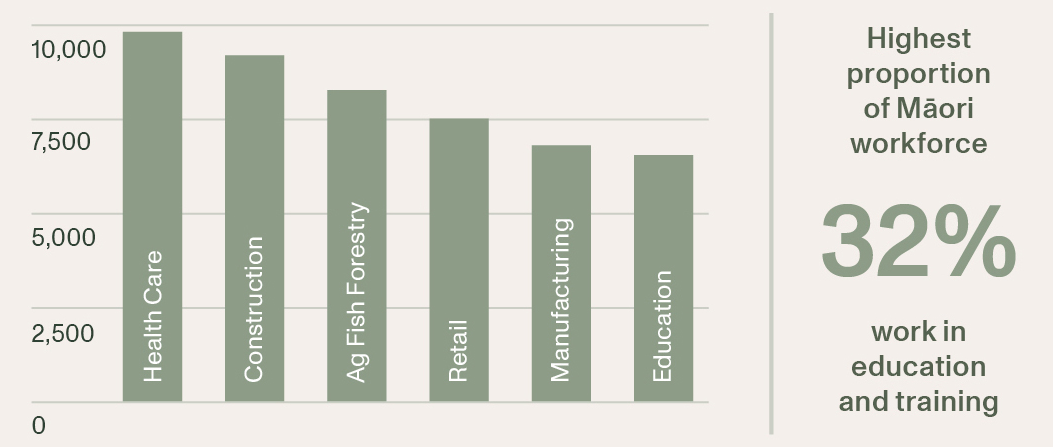
Despite those two named industries contributing significantly to our GDP the biggest employment industries in the north also include Health Care and Social Assistance (12.6%) and construction (11.8%).
Northland Region economic profile(external link) — Infometrics
Self-employment rates have been stable over the last decade. Data shows the employment models for some of our largest industries still include a notably high proportion of self-employment with over 40% of workers in both the construction sector and primary sector being self-employed.
Some of the challenges that SMEs encounter are the ability to secure lead contracts for significant projects, to invest in worker development and to integrate emerging technologies. If our local employers are to grow, and the rewards of the recent investments are to be shared equitably, then addressing these challenges is essential.
Northland Region workforce skills at a glance 2021
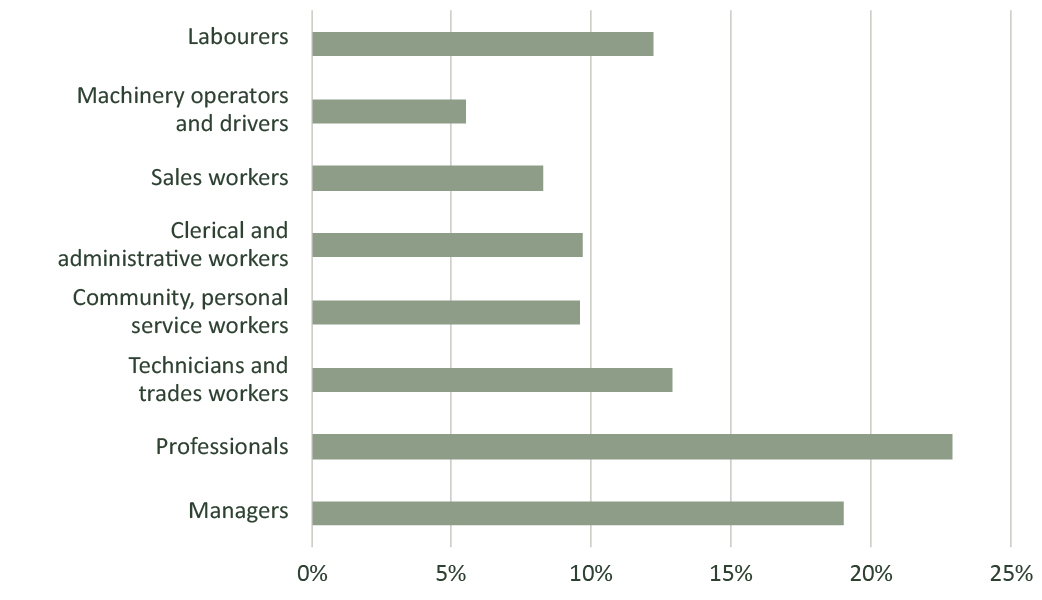
Text description of graph
Future workforce
A higher skilled workforce will be required to deliver a prosperous future for our rohe. To this end it is vital that the region’s tertiary education system aligns its performance with our needs.
Young Māori are crucial to the future wellbeing of the region, and it is therefore critical to increase Māori engagement and participation in tertiary education.
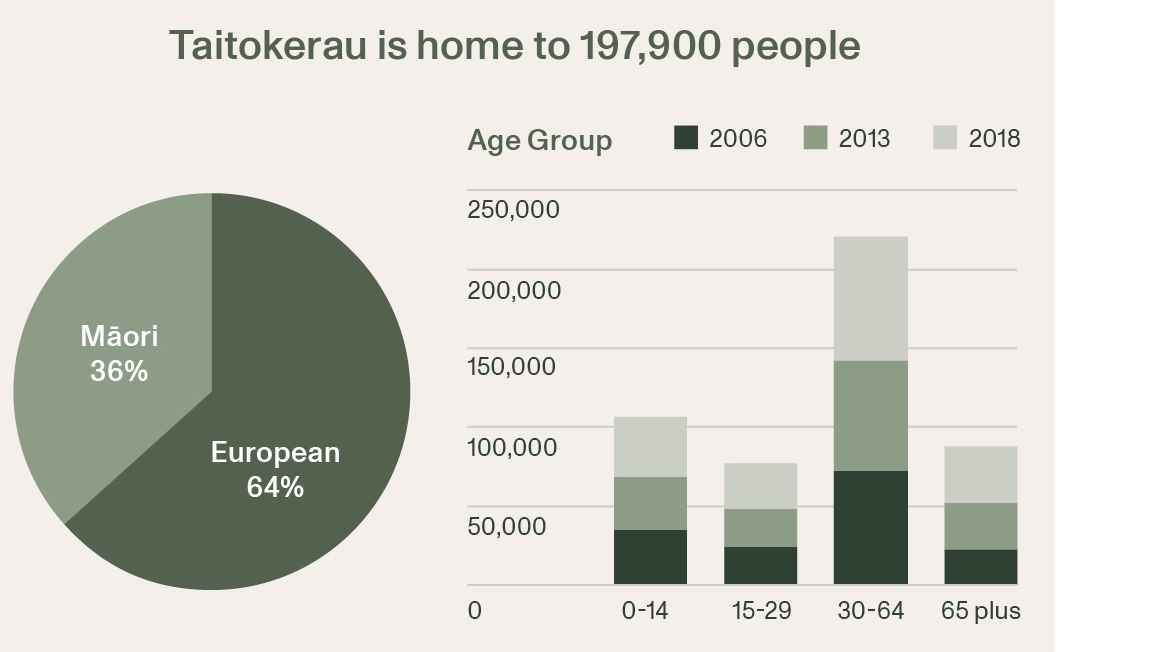
The future workforce will be shaped by our population growth and demographics. It is estimated that Taitokerau will be home to 231,200 people by 2048 with a significantly higher proportion of older people when compared to census 2018 data.
National population estimates: At 30 June 2022(external link)(external link) — StatsNZ
Technology advances (namely Machine Learning, Artificial Intelligence and robotics) are likely to see construction methods morph into something closer to manufacturing processes which will change the skills demand profile for this industry, particularly in urban areas. Such a shift in approach may help create more sustainable solutions to our dire housing shortage.
Technology advances are also likely to materially impact on all the sub-sectors in the primary industries, resulting in greater demand for technology and scientific skills.
We will need to resolve the persistent low digital skill and connectivity issues seen in some areas of our rohe for the benefits from these changes to be shared equitably.
The influence of climate change will be felt across the region, but especially in those communities where the economy is dependent on natural resources. A progressive move towards a greener, more resilient economy will demand new skills (located around science and technology) and this will mean that our education providers will need to shift the nature of their provision so our local taitamariki can learn while still in our rohe.
A higher skilled workforce will be required to deliver a prosperous future for our rohe.
Labour market
Text description of graph
High employment in health care and construction sectors
Text description of graph
Employing sectors by ethnicity
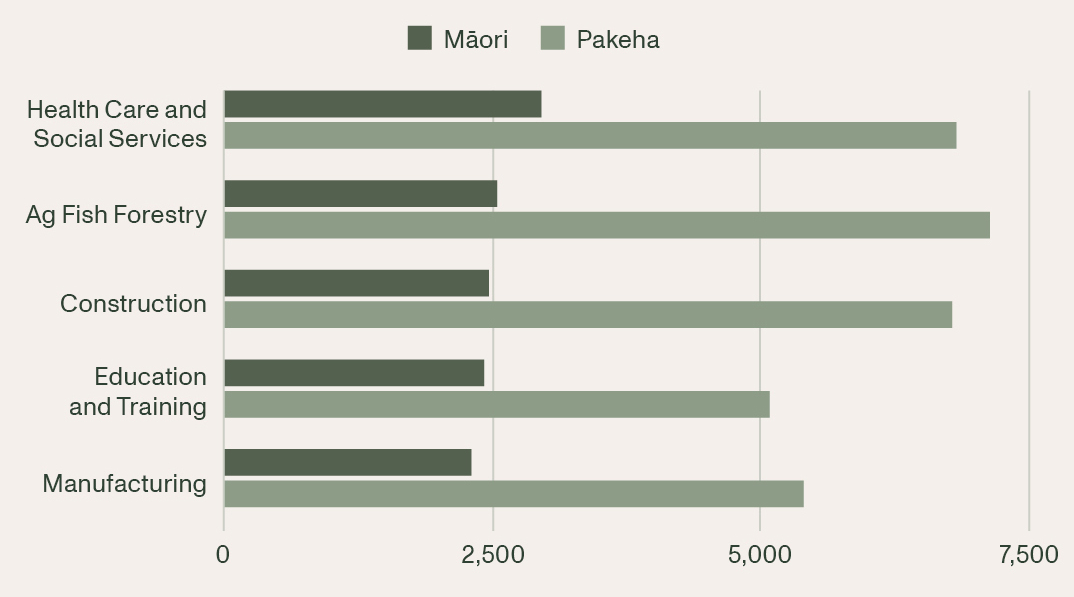
Text description of graph
Lower wage economy
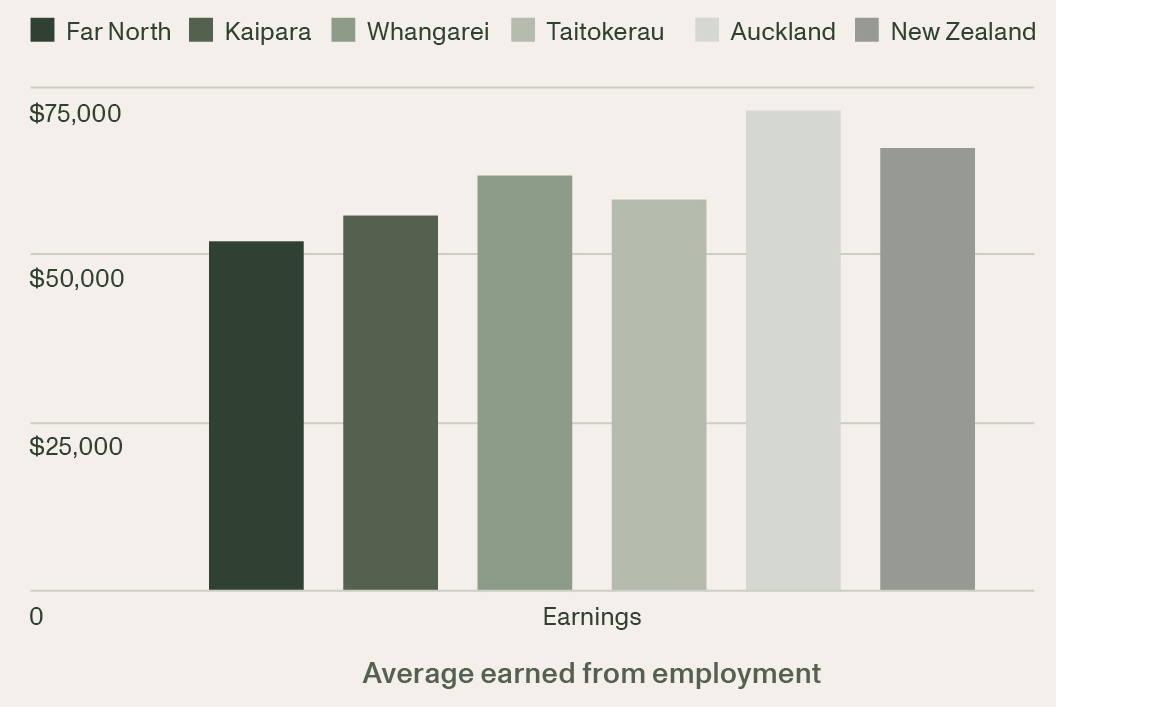
Text description of graph
Demand for skilled workers
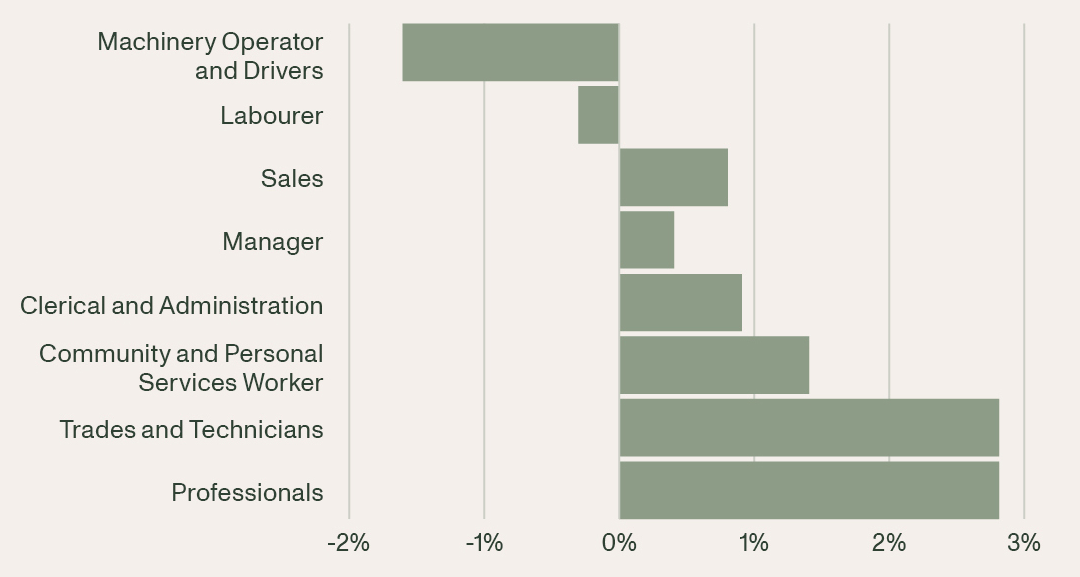
Text description of graph