Region
The commentary below presents the regional context for tourism in the year ending September 2019 (and for the September 2019 quarter where available). Key findings are below:
On this page
Mixed results for guest nights across regions
For the year ending September 2019, guest nights increased marginally across most regions. Annual growth in guest nights eased for South Island regions relative to the North Island, with the strongest growth in the South Island occurring in the Canterbury region, at 1.1 per cent. Central and lower North Island regions performed relatively strongly, particularly in Wellington and the Hawke’s Bay, up 3.2 per cent and 3.1 per cent respectively.
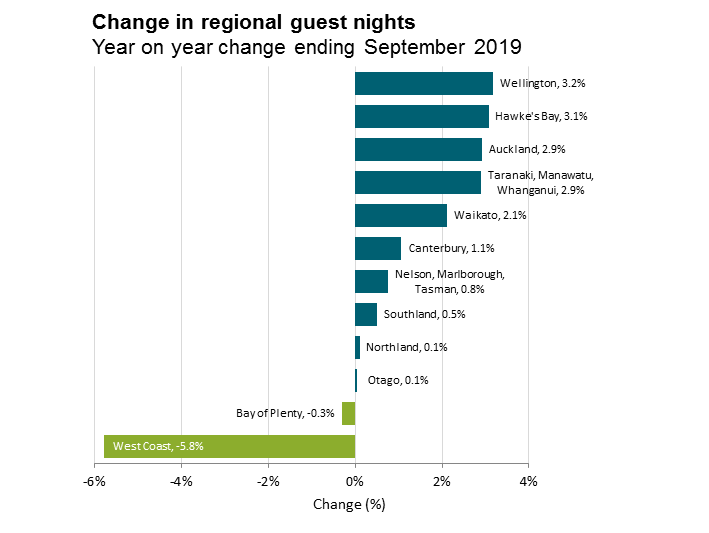
Source: Accommodation Survey, StatsNZ
Change in regional guest nights - data table
Growth in visitor spend reflects increased spending across most regions
The Monthly Regional Tourism Estimates (MRTEs) show that most regions achieved growth in tourism spend for the year ending September 2019, with growth particularly strong across the central North Island regions. The fastest-growing regions were Wellington (up 6.8 per cent), Taranaki (up 4.8 per cent) and the Bay of Plenty (up 4.2 per cent).
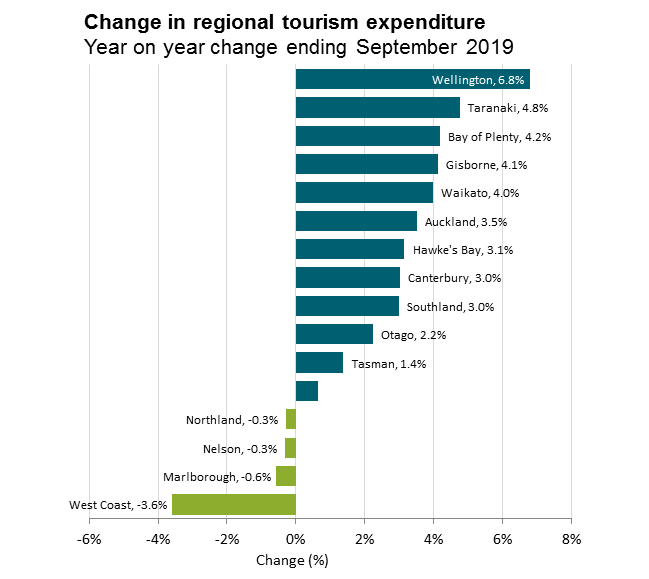
Source: Monthly Regional Tourism Estimates, MBIE
Change in regional tourism expenditure - data table
Growth in Wellington was driven by an increase in international tourism spend, up 12 per cent, and a smaller rise of five per cent for domestic spend. Similar to the Wellington Region, growth in Taranaki was driven primarily by an increase in international spend, up 13 per cent, and a smaller rise of three per cent for domestic spend.
West Coast affected by extreme weather
Tourism spend in the West Coast was down 3.6 per cent for the year ending September 2019, driven by lower domestic tourism spend which fell 8 per cent over the year. Commercial accommodation guest nights declined by 5.8 per cent over the same period. This follows the extreme weather front that caused wide spread flooding and demolished the Waiho Bridge in March 2019, followed by further flooding in early December 2019.
MRTE Insights Viewer
The MRTE Insights Viewer presents tourism spend data from the Monthly Regional Tourism Estimates in a map and shows key breakdowns by area. Data is available at Regional Council, RTO region, and Territorial Authority areas.