Weekly fuel price monitoring
We carry out weekly monitoring of importer margins for regular petrol, premium petrol and automotive diesel. This data is updated weekly, using the previous week's data.
On this page
About importer margins
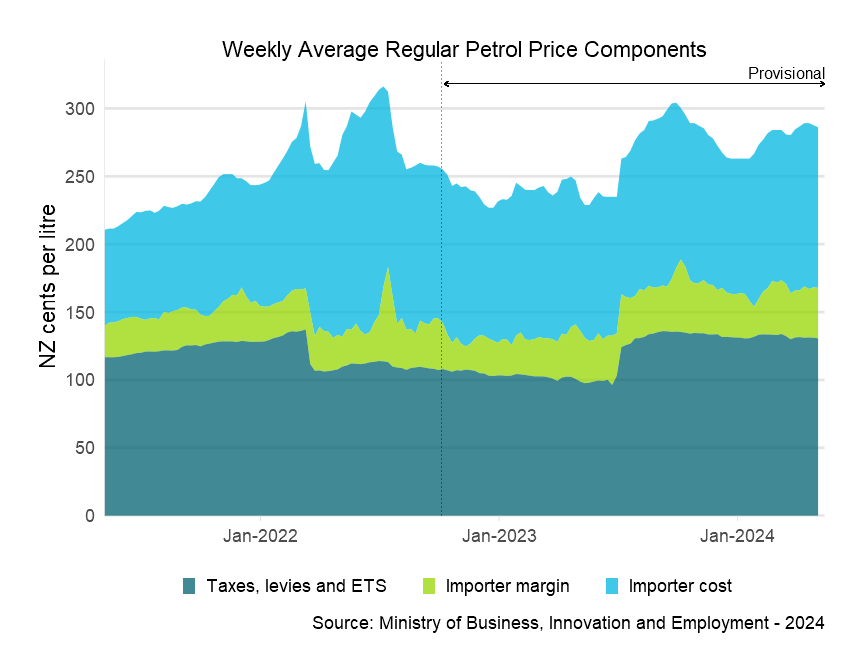
The importer margin is the gross margin available to fuel retailers to cover domestic transportation, distribution and retailing costs in New Zealand, as well as profit margins.
It's calculated as the difference between the:
- discounted price less duties, taxes, levies, the New Zealand Emissions Trading Scheme (ETS), and
- importer cost (cost of importing the fuel to New Zealand —including the cost of purchasing the fuel in Singapore, shipping it to New Zealand, insurance and losses, and wharfage and handling).
The calculation of importer margins was adjusted in September 2015 to include discounting activity. This adjustment has been carried back to October 2006.
Why we monitor importer margins
Margins are an indication of the competitiveness of New Zealand’s retail fuel market. This monitoring is a key recommendation from the 2008 New Zealand Petrol Review (see link below) to promote transparency in retail petrol and diesel pricing.
What changes we have made to the methodology used for monitoring importer margins
- We adjusted the calculation of importer margins in September 2015 to include discounting activity. This adjustment has been carried back to October 2006.
- In December 2018, we made adjustments to account for the introduction of the Auckland regional fuel tax on 1 July 2018.
Regional fuel tax impact on importer margins
Before to the introduction of the Auckland regional fuel tax on 1 July 2018, our method for monitoring weekly fuel prices and importer margins assumed that retail prices were the same across the country.
In December 2018 we applied 2 adjustments to the data to ensure the Auckland regional fuel tax is reflected in the data:
- the retail price series was adjusted, to account for price differences between Auckland and the rest of the country
- a weighted-average regional fuel tax has been added to the duties, taxes and direct levies data to account for the 10 cents per litre tax applicable only in the Auckland region.
We are working with other agencies and data providers to further develop this methodology to ensure that it is fit for purpose.
What is the discounted price?
The discounted price is calculated as the main port price less an estimated discount.
The main port price is a weekly average of retail prices in Auckland, Hamilton, Wellington, and Christchurch.
A minor adjustment was made to the main port price from 1 July 2018 to ensure that prices changes adequately reflected retail price change in Auckland following the introduction of the Auckland regional fuel tax. From October 2006 onwards, main port prices have been adjusted for the increased prevalence of discounting activity (through loyalty schemes, shopper coupons and regional discounting) to produce the discounted price.
The cost of discounting activity is borne by a range of parties. All other things being equal, this will tend to underestimate the importer margin attributable to oil companies.
As part of their Consumers Price Index (CPI) calculations, Statistics New Zealand surveys a selection of service stations in 12 regions of New Zealand, as well as collecting information about discounting from the major fuel retailers, to produce quarterly average prices. For more information on the calculation method, see the Stats NZ website.
Vehicle fuels and lubricants in the CPI(external link) — Stats New Zealand
Estimated discount
The estimated discount is calculated as the difference between the:
- quarterly average main port price, and
- quarterly average retail price series produced by Statistics New Zealand.
Each quarter:
- we forecast the discount for the quarter, then
- adjusts this forecast when Statistics New Zealand releases its latest data.
How we forecast the estimated discount
The CPI data for a given quarter is released a couple of weeks after that quarter has ended. This means that for the current quarter we must use a forecast. This forecast is revised with the actual estimated discount when the CPI data for the current quarter is released. We use an Auto Regressive Integrated Moving Average (ARIMA) model for forecasting.
Data in the weekly table and the graphs is flagged as “Provisional” if it uses forecasted discounts in the calculations. Otherwise it is flagged as “Final”.
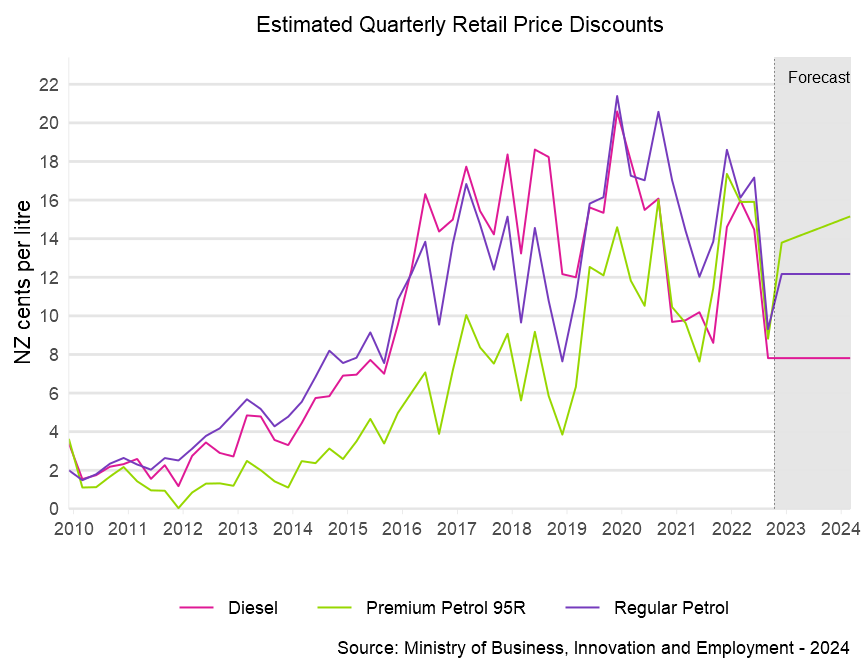
Estimated discounts since 2010
The graph below shows the estimated discounts since 2010 along with the current forecasts.
Graphs
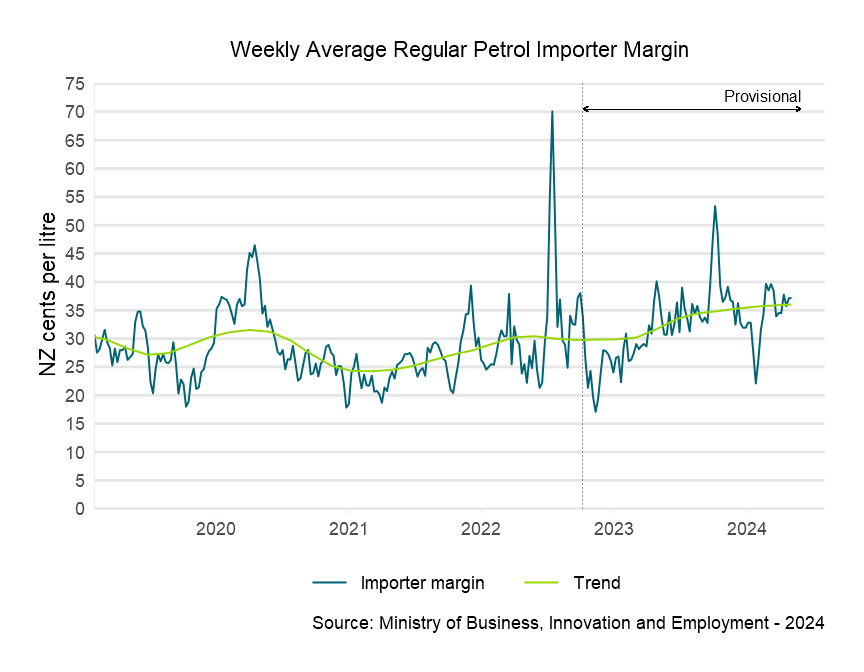
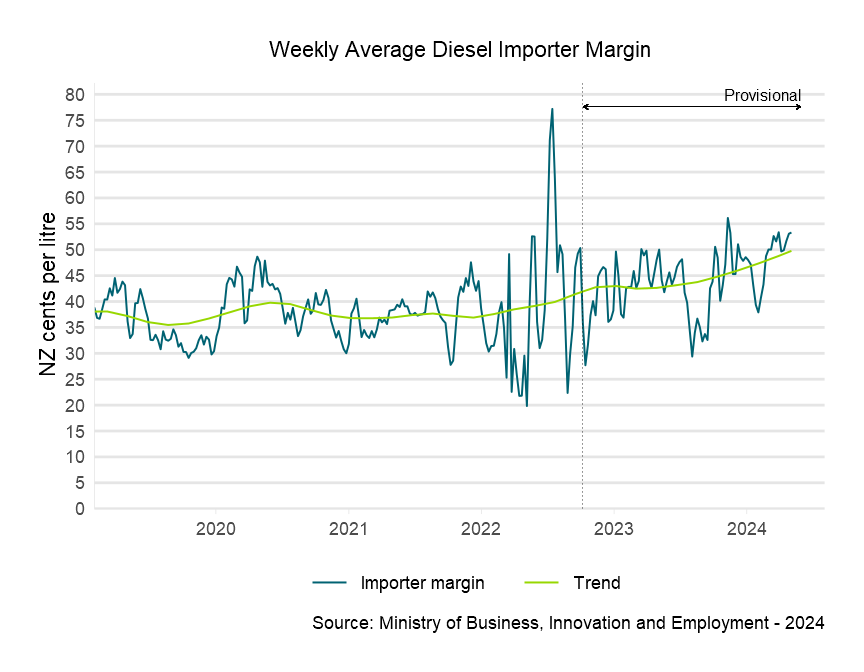
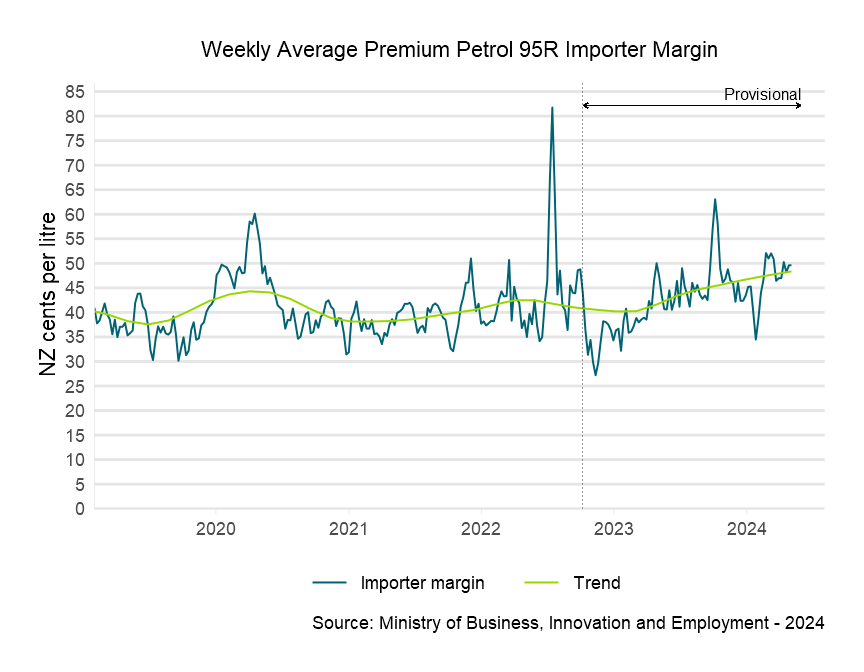
The following graphs show the latest fuel statistics up to the week ending 12 April 2024 (updated weekly).
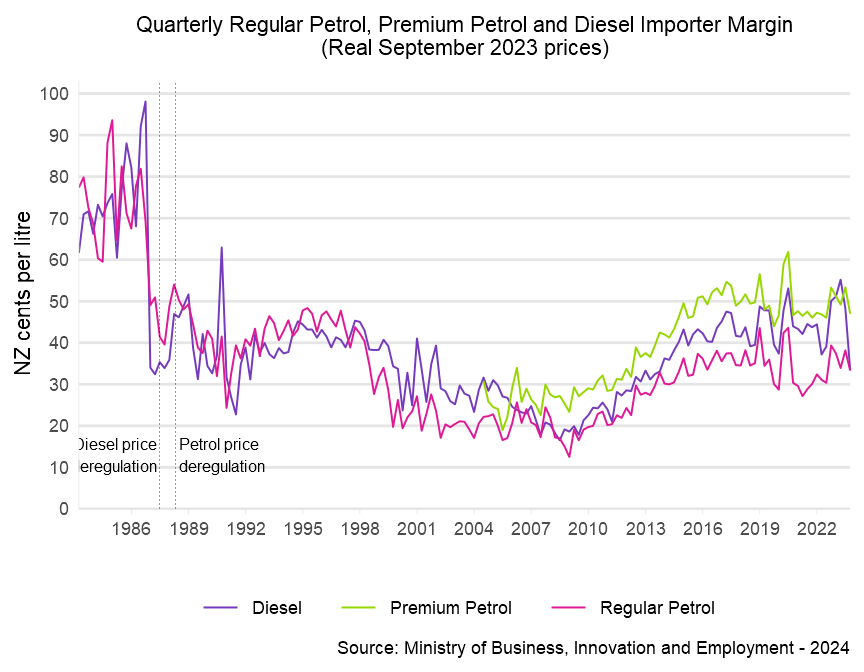
Weekly average importer margins
[CHART] Regular petrol
[CHART] Diesel
[CHART] Premium petrol 95R
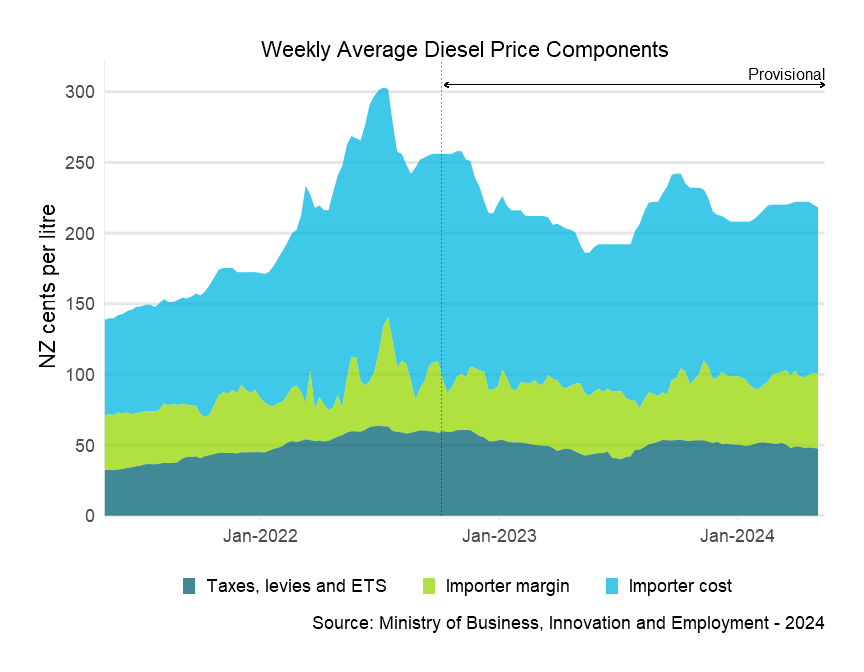
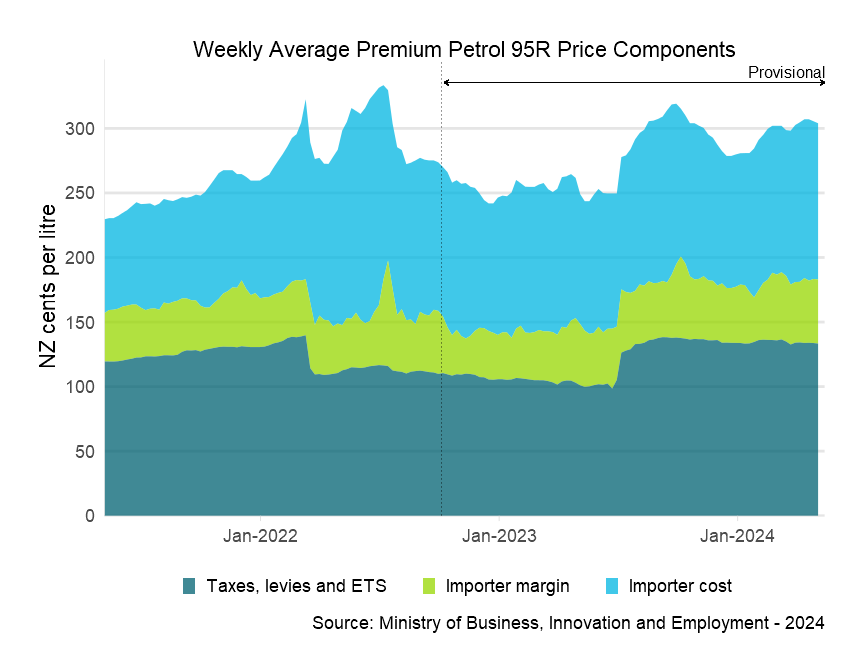
Weekly average price components for regular petrol
[CHART] Regular petrol
[CHART] Diesel
[CHART] Premium petrol 95R
Daily importer margin charts
Charts of the daily variability of the importer margin on regular petrol and diesel are also available, based on data provided by Hale and Twomey Ltd.
Note that the data in the charts are calculated using undiscounted retail prices, and will therefore generally be at a higher level than our weekly importer margins. Take care when comparing these series.
Data and data sources
Download the latest spreadsheet showing our forecast discounts and actual discounts for petrol and diesel.
Discount forecast tracking [XLSX, 19 KB]
Download the data used to produce the charts on this page.
This document explains the variables used in our weekly oil price monitoring.
Data sources
Data is sourced from:
- US Energy Information Administration(external link)
- Argus Media Limited(external link)
- International Energy Agency(external link)
- Hale & Twomey(external link)
- Pricewatch(external link)
- Statistics New Zealand(external link)
- Reserve Bank of New Zealand(external link).
All data are presented as non-weighted weekly averages, and adjusted to NZ dollars as appropriate — based on the prevailing exchange rate.
The costs associated with the Emissions Trading Scheme (ETS) are provided by Hale & Twomey based on the prevailing carbon price from the New Zealand Carbon Market.
This work is licensed under a Creative Commons Attribution 3.0 New Zealand Licence(external link)
Related content
Energy in New Zealand
This annual publication provides information on and analysis of New Zealand’s energy sector including statistics on supply, transformation, and demand.
Energy prices
Real and nominal price data relating to New Zealand’s energy prices — petrol, diesel, fuel oil, natural gas and electricity.